1. Introduction
 Toshiba
is a giant global manufacturer with a large product line and several divisions.
One of its divisions, the Storage Device Division, recently released the MK1032GAX
hard disc drive, a 2.5-inch HDD with 100GB capacity hard disk. According to
Toshiba, the MK1032GAX offers the industry's highest areal density per platter,
at 83.2 gigabits per square inch while the drive's 5400 RPM motor speed, improves
system-level performance by as much as 12 percent when compared to 4200 RPM.
Toshiba
is a giant global manufacturer with a large product line and several divisions.
One of its divisions, the Storage Device Division, recently released the MK1032GAX
hard disc drive, a 2.5-inch HDD with 100GB capacity hard disk. According to
Toshiba, the MK1032GAX offers the industry's highest areal density per platter,
at 83.2 gigabits per square inch while the drive's 5400 RPM motor speed, improves
system-level performance by as much as 12 percent when compared to 4200 RPM.
We received the MK1032GAX hard disk drive from Toshiba, shown below.


Features:
- 100GB capacity
- Rotational Speed of 5,400rpm
- Fluid Dynamic Bearing (FDB) motor drive
- 9.5mm High
-
12ms Average Seek Time
- ATA-6 Interface
- 100MB/sec Transfer Rate
- 16MB Buffer
-
300,000 MTTF Hours
Specifications:
| TOSHIBA MK 1032GAX 2.5" HDD 100GB |
| Data Storage Physical: |
| Per drive, formatted |
100.030GB |
| Data Heads |
4 |
| Number of Disks |
2 |
| Logical Configuration: |
| Heads |
16 |
| Cylinders |
16,383 |
| User Sectors/Track at zone 0 |
63 |
| Logical Blocks (LBA) |
195,371,568 |
| Data Transfer Rate: |
| Max transfer rate to host |
100MB/sec |
| Seek Time: |
| Track-to-track |
2ms |
| Average |
12ms |
| Maximum |
22ms |
| Nominal Power Requirements: |
| Logic |
+5V(+/-5%) |
| Start |
4.5watts (max) |
| Seeking |
2.4watts (typ) |
| Reading/Writing |
2.0watts (typ) |
| Idle |
0.85watts (typ) |
| Standby |
0.18watts (typ) |
| Sleep |
0.1watts (typ) |
| Other: |
| Rotational Speed |
5,400rpm |
| Average Latency |
5.55ms |
| Interface |
ATA-2/3/4/5/6 |
| Buffer |
16MB |
| Dimensions/Weight: |
| Height |
0.37" (9.5mm) |
| Width |
2.75" (69.85mm) |
| Depth |
3.94" (100mm) |
| Weight |
3.56 oz (101g) |
| Ambient Temperature: |
| Operating |
41o - 131oF (5o to 55oC) |
| Non-Operating |
-4o - 140oF (-20o to 60oC) |
| Shipping |
-40o - 158oF (-40o to 70oC) |
| Vibration and Shock: |
| Operating Vibration |
9.8 m/s2 (1.0G), 5 - 500 Hz |
| Operating Shock |
325g |
| Non-Operating Shock |
850g |
| Other: |
| Preventive Maintenance |
None |
| MTTF (Power on hours) |
5 years or 20,000 power ON hours |
| Product Life |
5 years or 20,000 power ON hours |
In order to investigate the difference between a 5400rpm HDD with 16MB buffer
and a 4200rpm HDD with 8MB buffer, we compared the Toshiba MK1032GAX with the
Fujitsu MHT2080AT. We chose to use the Fujitsu drive in this comparison due
to the fact that most notebooks have a drive similar to the Fujitsu HDD.
2. HD-Tach
In order to test the Toshiba MK1032GAX, as well as the comparison HDD from
Fujitsu, we used Teac's external USB2.0 case.
HD Tach tests the sequential read, random access and interface burst speeds of your attached storage device (hard drive, flash drive, removable drive, etc). All drive technologies such as SCSI, IDE/ATA, 1394, USB, SATA and RAID are supported. Test results from HD Tach can be used to confirm manufacturer specs, analyze systems for proper performance as well as allow you to compare performance with others.
This benchmark is intended to determine the maximum read or write speed of
the device at various locations. Hard drives, for example, have faster read/write
speeds at the inside edge (mapped to block 0) of the device, so it is useful
to see the difference in speed. The maximum sustained speed (lowest speed on
the device) is an important metric for real time sequential access applications.
The maximum speed may be important to a power user that would like to partition
the drive into a high speed partition and low speed partition.


Click to enlarge

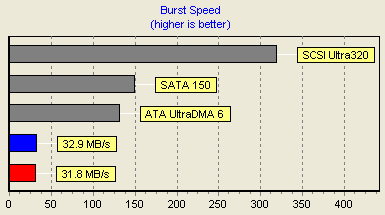
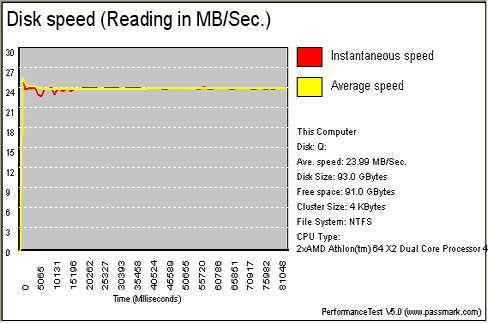
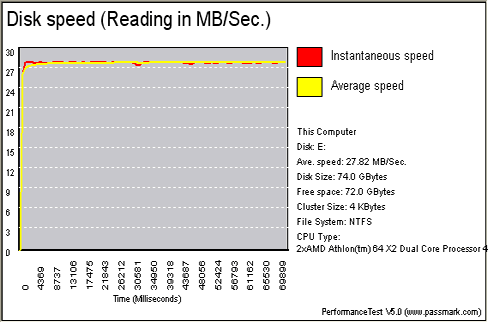
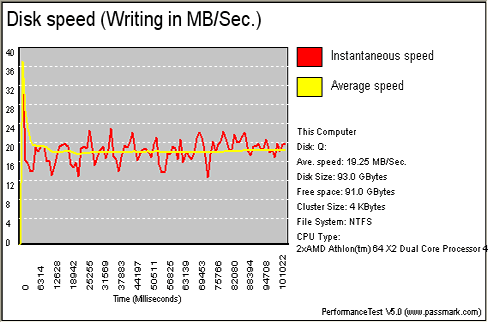
The performance of the Toshiba hard disk was better than the Fujitsu,
in both reading and writing, as reported by HD-Tach. Toshiba has an average
reading speed of 28.2MB/s while the Fujitsu 23.1MB/s. In writing however, there
is a huge difference between the two drives. The Fujitsu drive reported a rather
low average writing transfer rate of 0.4MB/s while the Toshiba 32MB/s. In order
to be 100% sure, we repeated the test with the Fujitsu three times, even on
different motherboards.
3. Performance Test v5.0
 Passmark PerformanceTest is an award winning PC hardware benchmark utility that allows everybody to quickly assess the performance of their computer and compare it to a number of standard 'baseline' computer systems.
Twenty seven standard benchmark tests are available in seven test suites plus there are five advanced testing windows for custom benchmarking. CPU Tests, 2D Graphics Tests, 3D Graphics Tests, Disk Tests, Memory Tests and CD/DVD Tests. In our case we selected the Disk Tests suite.
Passmark Disk Test
This suite contains a number of tests that exercise the mass storage units (hard disk or otherwise) connected to the computer. By default drive C: is used but this can be changed from the Preferences Dialog.
For each test a file is created in the root directory of the selected disk. The file size needs to be large in order to get an accurate measurement. In the case where a slow drive is used on a computer with a large amount of RAM this test can take some minutes to complete.
There are a few issues to aware of when interpreting the results of the disk test. These are covered in the precautions section.
- Disk Sequential Cached Read
A large test file is created on the disk under test. The size of this test file is proportional to the amount of RAM available, which stops the entire file from being cached in RAM. The file is read sequentially from start to end. The amount of data read in each individual read operation is always 16KB
- Disk Sequential Cached Write
A large file is written to the disk under test. The size of this test file is proportional to the amount of RAM available. This stops the entire file being cached in RAM. The file is written sequentially from start to end. The amount of data written in each individual operation is always 16KB
- Disk Random cached Seek RW
A large test file is created on the disk under test. The size of this test file is proportional to the amount of RAM available, this stops the entire file being cached in RAM. The file is read randomly; a seek is performed to move the file pointer to a random position in the file, a 16KB block is read or written then another seek is performed. The amount of data actually transferred is highly dependent on the disk seek time.
It is clear from the table above, that the Fujitsu hard disk has higher transfer
rates with sequential reads and writes, while the Toshiba was better at Random
Seek R+W.
- Reading Test
 |
| Toshiba |
 |
| Fujitsu |
4MB/sec is the difference between the Fujitsu and the Toshiba for the reading test.
- Writing Test
 |
| Toshiba |
 |
| Fujitsu |
Approximately 1MB/sec faster writing with the Fujitsu hard disk.
4. SiSoftware Sandra 2005

SiSoftware Sandra is a 32 and 64-bit Windows system analyser that includes benchmarking, testing and listing modules. It tries to go beyond other utilities to show you more of what is really going on under the hood so you draw comparisons at both a high and low-level in a single product.
You can get information about the CPU, chipset, video adapter, ports, printers, sound card, memory, network, Windows internals, AGP, ODBC Connections, USB2, Firewire etc. You can save/print/fax/e-mail/post/upload or insert into ADO/ODBC databases reports in text, HTML, XML, SMS/DMI or RPT format.
This version supports multiple sources of information gathering including: remote computers, PDAs, Smart Phones, ADO/ODBC databases or saved system reports. All benchmarks are optimised for both SMP & SMT (Hyper-Threading), up to 32/64 CPUs depending on the platform.
File system Benchmark
- The "File system Benchmark" tests how your drive(s) and controller(s) compare to other devices in a typical system:
· Read Test: Buffered, Random, Sequential
· Write Test: Buffered, Random, Sequential
· Seek Test
The "Drive Index" mark is a composite figure representing an overall performance rating based on the average of the read, write, and seek tests, and file and cache size. The Drive Index is intended to represent drive performance under typical use in a PC. A larger number means better performance. The weighting of the results is not equal and represents the distribution of different files sizes as used on these devices (obtained through field research).

Similar performance from both drives, with the Fujitsu being slightly better.
Removable Storage/Flash Benchmark
- The "Compact Flash" typical usage model for these devices is File operations, such as Writing a file to the device, reading a file from it, and deleting a file. This benchmark exercises the devices in terms of these operations (to measure the “raw” cluster level performance of the device, it is recommended to also test it by means of the File System Benchmark module). The following characteristics are measured for each of the four representative file sizes of 512 Bytes (representing a minimal single data cluster file), 32kB, 256kB and 2MB. The weighting of the results is not equal and it represents the distribution of different files sizes as used on these devices (obtained through field research). For each of the four file sizes, a Combined Index is then calculated, stating the combined performance in terms of Combined Operations Per Second, with respect to a mix of write, read and delete operations.
- Combined Device Index: is a composite figure representing an overall performance rating based on the average of the Combined Index figures over the four file sizes. (Higher is better, i.e. better performance)
- Endurance Factor: is a figure representing the Wear and Life Expectancy of flash devices; this is obtained by dividing the average performance (normal condition, i.e. sequential write) to the lowest performance (high-stress condition, i.e. same block re-write). It measures the relative improvement of endurance caused by the wear leveling or flash management algorithm; the absolute endurance of a device (i.e. its expected life-time) is directly dependent, in addition to this Endurance Factor, on the nominal manufacturer rating of maximum erase/reprogram cycles, which is typically 100,000+ for SLC and 10,000+ for MLC devices. (Higher is better, i.e. longer life-time for the device)

Once more, there is a small difference in performance between the two tested
drives. The smaller capacity might be the reason for this.
5. PCMark05
PCMark05 is an application-based benchmarks and a premium tool for measuring overall PC performance. It uses portions of real applications instead of including very large applications or using specifically created code. This allows PCMark05 to be a smaller installation as well as to report very accurate results. As far as possible, PCMark05 uses public domain applications whose source code can be freely examined by any user.
PCMark05 includes 4 categorized suites for benchmarking your computer. These include CPU, Graphics, Memory and a Hard Disk Drive benchmark. In our case, we selected only the Hard Disk Drive benchmark.

In this test, it seems the Toshiba HDD overall, is better than the Fujitsu.
The test results are given more analytically below:
| HDD Test Suite |
Toshiba |
Fujitsu |
| XP Startup (MB/sec) |
5.919 |
4.841 |
| Application Loading (MB/sec) |
4.933 |
3.905 |
| General Usage (MB/sec) |
4.027 |
3.211 |
| Virus Scan (MB/sec) |
16.601 |
26.549 |
| File Write (MB/sec) |
23.625 |
26.081 |
The Toshiba seems to be better during XP Startup, Application Loading and General
Usage while the Fujitsu in the Virus Scan and File Write tests.
6. Conclusion
The Toshiba name has been a synonym for quality and reliability. The MK1032GAX
HDD with its increased capacity of 100GB, makes it a great solution for notebooks
or portable devices. Moreover, it is among the fastest 2.5" hard disk drives
on the market, with a rotation speed of 5400rpm and 12ms average seek time.
The 16MB buffer is promises great performance while the 300,000 Hours MTTF,
guarantees that this hard disk is going to last for a long time.

Our primary aim was to see the difference in performance between
the Toshiba and another recent 2.5" hard disk drive, one with an equally
large capacity, the Fujitsu MHT2100AH with 80GB of storage, 8MB buffer and rotation
speed of 4200rpm. According to our tests, the Toshiba HDD was faster in some
benchmarks while in others, the Fujitsu was better. PCMark showed that the Toshiba
HDD seems to be better during XP Startup, Application Loading and General Usage
while the Fujitsu was better during Virus Scans and File Writes. All in all,
the Toshiba MK1032GAX did not impress as much as we had expected considering
its higher rotational speed and larger buffer.
At the time of this review, the price for the Toshiba MK1032GAX
on the e-market was around US$175 ( newegg.com) while for the Fujitsu MHT2080AT
US$101. The Toshiba has larger capacity and better specifications but this does
not warrant the huge price difference. Fujitsu also offers HDDs at 100GB with
8MB buffer at 4200rpm (MHT2100AT) for US$145 and the MHT2100AH with 100GB capacity,
16MB buffer at 5400rpm for US$155. The final decision is yours...