1. Introduction
Intel is amongst the largest, if not the largest, CPU manufacturer worldwide. Today, Intel supplies the computing and communications industries with chips, boards, systems and software building blocks that are the "ingredients" of computers systems, servers, networking and communications products. The Pentium 4 6xx series has been available for over a year now.
 Intel's 6xx series of processors, were released in response to AMD's very popular 64bit processor. The 6xx series has many similarities with the Prescott and 5xx series, such as 800 MHz FSB and 31-stage pipelines, but it has some extra features such as:
- EM64T : Intel Extended Memory 64 Technology (Intel EM64T) is an enhancement to Intel's IA-32 architecture. The enhancement allows the processor to run newly written 64-bit code and access larger amounts of memory.
- 2MB L2 Cache : A larger cache size can help the processor more efficiently run many popular
applications in digital imaging, music, video and gaming.
- Enhanced SpeedStep : Enables cooler and quieter PC designs (depending on system implementation and
usage).
- Execute Disable Bit : Can improve protection against malicious "buffer overflow" attacks when properly enabled with a supporting operating system.
Processor Features & Definitions |
| Architecture |
Basic design of a microprocessor. May include process technology and/or other architectural enhancements. |
Cache
(MB/KB) |
A temporary storage area for frequently accessed or recently accessed data. Having certain data stored in a cache speeds up the operation of the computer. Cache size is measured in megabytes (MB) or kilobytes (KB). |
Clock Speed
(GHz/MHz) |
Speed of the processor's internal clock, which dictates how fast the processor can process data. Clock speed is usually measured in GHz (gigahertz, or billions of pulses per second). |
Front Side Bus
(GHz/MHz) |
The connecting path between the processor and other key components such as the memory controller hub. FSB speed is measured in GHz or MHz. |
The full Pentium 4 6xx series is given below:
| Model |
Clock Speed |
L2 Cache |
Socket |
FSB |
| Pentium 4 660 |
3.6GHz |
2MB |
LGA-775 |
800MHz |
| Pentium 4 650 |
3.4GHz |
2MB |
LGA-775 |
800MHz |
| Pentium 4 640 |
3.2GHz |
2MB |
LGA-775 |
800MHz |
| Pentium 4 630 |
3.0GHz |
2MB |
LGA-775 |
800MHz |
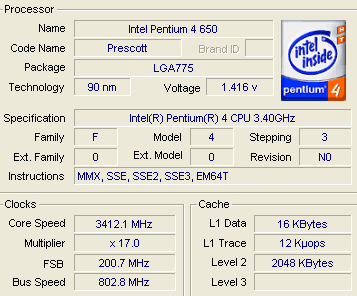
The sample we received from Intel was the P4 650 running at 3.4GHz. Below you can see the 650 installed in the 775 socket. The method used to clamp down the processor in the socket, is one of the best possible. When uninstalling the cooler, there is no chance of damaging the CPU, as is the case with the AMD 939 socket processors, where most times the CPU comes off along with the cooler and could possibly damage the pins if you're not careful.
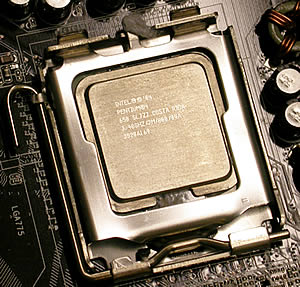

The CPU is a 775 socket, just like the Prescott series. As you can see, there are no pins on the CPU chip itself. Instead, they are located on the motherboard socket.

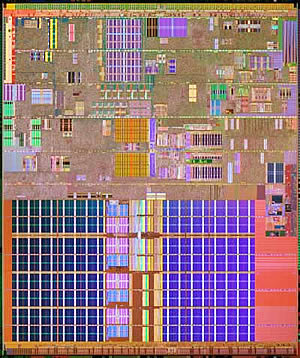 |
| The Core of the 650... |
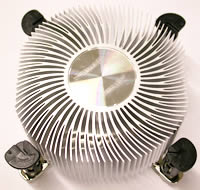
The stock cooler included in the BOX version for the 6xx series has seven large blades and one four-pin power connector.

The base is made of aluminium. Other Intel processors we have reviewed have had a copper base.

When we removed the fan to reveal the heatsink, we found that the base the fan sits on is solid aluminum. In other 6xx processor we have seen, this base is hollow as shown in the photos below.
 |
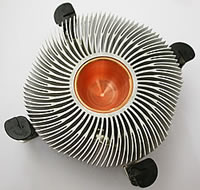 |
| Under the fan... |
The retail box includes the CPU, cooling system, warranty and installation manual.
2. Test System - Configuration
Here's a rundown of our testbed used to test the Intel P4 650 3.4Ghz processor:
System Specifications:
CPU: Intel Pentium 4 650
Cooler: stock
Case: Antec
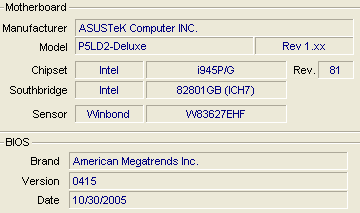
Motherboard: Asus P5LD2 Deluxe
Power supply: Thermaltake PurePower 520W
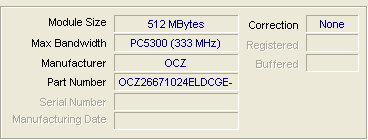
Memory: 2X512MB OCZ DDR2 PC2-5400 (dual channel)
VGA: AOpen Aeolus 6800Ultra PCI-E
Hard Disk Drive: WD800JD 80GB 7200RPM
OS: Windows XP Pro SP2
Drivers: 77.77
DirectX: v9.0c
The 650 runs by default at 3.4GHz with the multiplier preset at 17. This can be reduced down to 14 from the BIOS.
Benchmarks & Applications used
- Sisoft Sandra 2005
- Prime95
- PCMark04
- PCMark05
- 3DMark01
- 3DMark03
- 3DMark05
- PassMark Performance Test V5.0
- Half Life 2 - VST
- Doom 3
- FlaskMPEG
- DVD Shrink
- dBPower
- WinRAR
- CPU-Z
- SpeedFan

3. SiSoft Sandra 2005
SiSoftware Sandra is a 32-bit and 64-bit Windows system analyser that includes benchmarking, testing and listing modules. It also provides information about the CPU, chipset, video adapter, ports, printers, sound card, memory, network, Windows internals, AGP, ODBC Connections, USB2, Firewire, etc.
The CPU Arithmetic benchmark tests how your CPU stacks up against other typical combinations:
Multi-Processor (SMP) support for up to 32/64 CPUs & SMT
- Test takes about 20/30 seconds on P6-class PCs
- Test is repeated 3 to 5 times to get a realistic result
- Results outside the confidence limits (5%) are discarded
- Command Line Switch: CPUAABench
- Requirements: None
- OS (Win32) Support: Windows 2000, XP, 2003
- OS (Win32 CE) Support: PocketPC 2000/2002/2003, SmartPhone 2002, 2003
- OS (Win64) Support: Windows XP/2003
Sandra's CPU arithmetic benchmark suite uses 2 famous benchmarks (Dhrystone and Whetstone) for stress testing the processor. Also, it includes a new version of the Whetstone test that makes use of a processor's SSE2 instructions to show the performance boost an application might gain should it be optimized for SSE2. Unfortunately, this does not always represent true real-life performance, but is useful for comparing the speed of various CPUs.
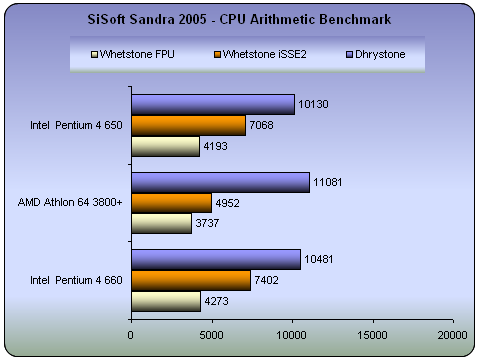
With Whetstone and WhetstoneiSSE2, both Pentium 4 processors had better performance than the AMD 3800+, which however outperformed the Intel processors in the Dhrystone test.
The CPU Multi-Media benchmark tests how your CPU stacks up against other typical combinations:
- Multi-Processor (SMP) support for up to 32/64 CPUs & SMT.
- Test takes about 20 seconds on P6-class PCs.
- Test is repeated 3 to 5 times to get a realistic result.
- Results outside the confidence limits (5%) are discarded.
- Command Line Switch: CPUMMBench
- Requirements: MMX (Enhanced), 3DNow! (Enhanced) or SSE(2/3) recommended
- OS (Win32) Support: Windows 2000, XP, 2003
- OS (Win64) Support: Windows XP/2003
The test has two parts:
Integer test - using integer data:
- MP SSE3 is used for better performance if supported.
- MP SSE2 is used for better performance if supported.
- MP SSE (Streaming SIMD) is used for better performance if supported.
- MP Enhanced MMX is used for better performance if supported.
- MP MMX is used for better performance if supported.
- MP ALU is used otherwise.
Floating-point test - using floating point data:
- MP SSE3 is used for better performance if supported.
- MP SSE2 is used for better performance if supported.
- MP SSE (Streaming SIMD) is used for better performance if supported.
- MP 3DNow! Enhanced is used for better performance if supported.
- MP 3DNow! is used for better performance if supported.
- MP FPU is used is used otherwise.
This test involves the generation of Mandelbrot Set fractals that are used to realistically describe and generate natural objects such as mountains or clouds. By using various multi-media extensions (MMX), 3DNow! and SSE(2/3), better performance is achieved.
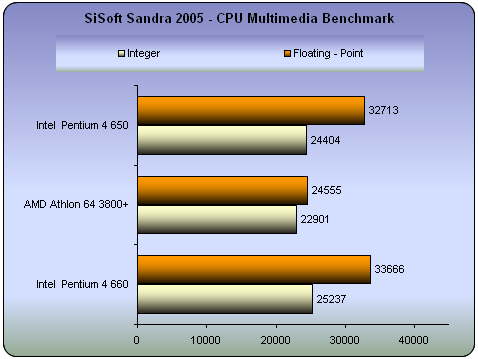
The P4 processors reported much better results, especially in the floating-point department, probably due to SSE3 instruction support.
4. PCMark04 & 05
PCMark04 and 2005 are application-based benchmarks and a premium tool for measuring overall PC performance. It uses portions of real applications instead of including very large applications or using specifically created code. This allows PCMark04 to be a smaller installation as well as to report very accurate results. As far as possible, PCMark04 uses public domain applications whose source code can be freely examined by any user.
Both PCMark04 and PCMark05 include 4 categorized suites for benchmarking your computer. These include CPU, Graphics, Memory and a Hard Disk Drive benchmark. In our case, we selected only the CPU test suite.

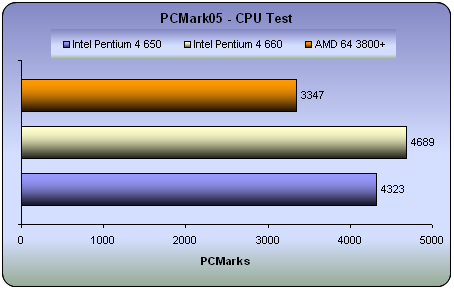
As was expected, the P4 660 earned the most PCMarks. The P4 650 follows closely behind while the AMD is a good deal behind.
The test results, more analytically:
| |
650 |
660 |
AMD 3800+ |
| File Compression (MB/sec) |
4.8 |
5.3 |
3.3 |
| File Encryption (MB/sec) |
63.4 |
65.6 |
37.2 |
| File Decompression (MB/sec) |
41.0 |
42.9 |
28.9 |
| Image Processing (MPixels/sec) |
16.7 |
16.9 |
14.6 |
| Grammar Check (KB/sec) |
4.0 |
2.4 |
6.5 |
| File Decryption (MB/sec) |
97.7 |
102.3 |
74.2 |
| Audio Conversion (KB/sec) |
2665.0 |
2779.1 |
3171.9 |
| WMV Video Compression (FPS) |
59.1 |
59.7 |
56.2 |
| DivX Video Compression (FPS) |
78.1 |
77.6 |
71.8 |
The AMD 3800+ is still better in the Grammar Check and Audio Conversion and by a sizable distance. In all other tests, the Intel processors lead.
| |
650 |
660 |
3800+ |
| File Compression (MB/sec) |
8.782 |
9.528 |
8.907 |
| File Decompression (MB/sec) |
134.073 |
144.987 |
138.502 |
| File Encryption (MB/sec) |
77.649 |
83.967 |
44.798 |
| File Decryption (MB/sec) |
75.161 |
81.293 |
40.804 |
| Image Decompression (MPixels/sec) |
27.593 |
29.708 |
26.684 |
| Audio Compression (KB/sec) |
2228.157 |
2411.791 |
2665.770 |
| Multithreaded Test 1 |
| File Compression (MB/sec) |
6.297 |
6.689 |
4.464 |
| File Encryption (MB/sec) |
39.149 |
42.923 |
22.298 |
| Multithreaded Test 2 |
| File Decompression (MB/sec) |
40.032 |
43.769 |
35.055 |
| File Decryption (MB/sec) |
19.971 |
21.539 |
10.235 |
| Audio Decompression (KB/sec) |
669.745 |
761.605 |
550.717 |
| Image Decompression (MPixels/sec) |
8.256 |
8.771 |
6.789 |
Great overall performance from the P4 processors. The 650 lagged slightly behind the 660 and apart from file compression and decompression, and audio compression, performed far better than the AMD 3800+.
5. 3DMark03
3DMark is a widely used and accepted benchmark that stresses the DirectX performance of a VGA card. For testing the performance of each card, we use the 4 game benchmark available with 3DMark. The first is a DirectX 7 game, the second and the third use DirectX 8 and the last one stresses graphics in DirectX 9. A very strong point of 3DMark is that its VGA card measurement does not require a lot of CPU power. However, the software includes benchmarks for testing the performance of the CPU. This is what we have chosen here.
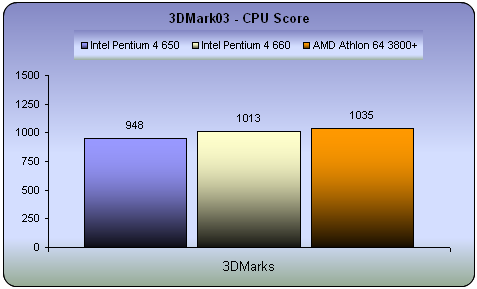
In this test, the AMD 3800+ had the highest 3DMark CPU score.
6. 3DMark05
3DMark05 is best suited for the latest generation of DirectX®9.0 graphics cards. It is the first benchmark to require a DirectX9.0 compliant hardware with support for Pixel Shaders 2.0 or higher! By combining high quality 3D tests, CPU tests, feature tests, image quality tools, and much more, 3DMark05 is a premium benchmark for evaluating the latest generation of gaming hardware. 3DMark05 is the answer to the continuously growing challenge in benchmarking.
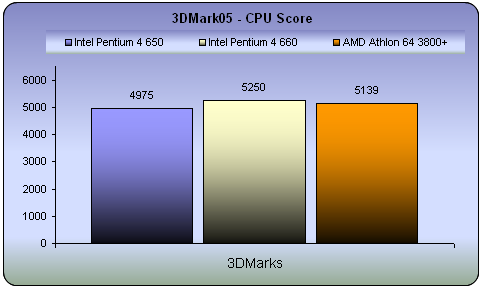
More recent than the 3DMark03 benchmark from the previous page, 3DMark05 recorded better performance from the Intel 660, with the AMD 3800+ following close behind.
7. Performance Test v5.0
CPU Benchmarks
The suite of PassMark Performance Tests contains multi-process CPU tests such as:
- Integer (32-bit addition, subtraction, multiplication and division)
- Floating Point (32-bit addition, subtraction, multiplication and division)
- WIN32: MMX (matrix multiplication) or WIN64: 64bit Integer Matrix Multiplication
- WIN32: SSE (128-bit SSE operations such as addition, subtraction and multiplication) or WIN64: 64bit Floating Point Matrix operations
- WIN32: 3Dnow! (3D transformation of an array of 32-bit vertices) or WIN64: 64bit Floating Point Matrix operations
- Compression
- Encryption
- Image Rotation (Rotate image co-ordinates in memory)
- Random String Sorting
Integers are whole numbers such as 23, 459532, -26. Floating point numbers contain a fractional part, e.g. 1.003, 98394.2. These two types of numbers are treated quite differently inside a CPU, which is why PerformanceTest differentiates between the two.
For each of the integer tests, a large array of random 32 bit integers is processed using the particular mathematical operations listed below. For the floating point tests, single precision floating point numbers (32 bit) are used.
The "PassMark rating" is a weighted average of all the other test results and gives a single overall indication of the computer's performance. The bigger the number, the faster the computer. The "PassMark rating" can only be calculated if the results from all other tests are available. The value is calculated as follows.
| Test Suite |
Weighting |
| Disk |
20% |
| CD / DVD |
9% |
| Memory |
18% |
| 3D Graphics |
12% |
| 2D Graphics |
14% |
| CPU |
27% |
| Total |
100% |
In our case however, we only ran the CPU test suite.
First, we chose "All" the tests for the CPU, as described above.
There is no great difference between the 650 and the 660 processors, as reported by the specific test. The AMD 3800+ follows behind by quite a distance in some tests.
As was expected, the P4 3.73Ghz ED was better in all cases.
Multitasking Benchmarks
The Advanced Multi Process Test from the PassMark benchmark is designed to run a series of standard benchmark tests in parallel, to examine the performance under these conditions. Multiple processor machines should excel under this kind of environment, as the load is split between the various CPUs.
The tests include a number of the standard PassMark benchmarks along with some popular benchmarking algorithms and tests which emulate some day-to-day operations your CPU may be required to carry out which are particularly processor heavy.
As the tests are quite varied, as are their results, it unfortunately means that no graphing feature exists as is common amongst the other Advanced Tests. However, it is still possible to export the various results to HTML as usual.
| Test Name |
650 |
660 |
3800+ |
Primes found |
| Prime Number Search |
57306 |
58029 |
46072 |
Primes Found |
| Sorting Random Strings |
173887 |
176930 |
119950 |
Thousand strings sorted per second |
| Compression |
298 |
309 |
223 |
KBytes per second |
| Encryption |
1612.63 |
1688.33 |
1091.04 |
KBytes per second |
| Rotation |
26.17 |
26.95 |
14.75 |
Rotation per second |
| MMX Addition |
54.05 |
55.45 |
76.18 |
Million Ops/Sec |
| MMX Multiplication |
57.83 |
60.21 |
74.43 |
Million Ops/Sec |
| Integer addition |
87.50 |
88.56 |
49.23 |
Million Ops/Sec |
| Whetstone |
260.47 |
265.63 |
234.15 |
Million Ops/Sec |
| Dhrystone |
301.36 |
311.17 |
273.17 |
Million Ops/Sec |
When multitasking, the 660 is best with the 650 not too far behind, something we cannot say of the AMD 3800+.
More details about each test below:
The Tests
- Prime Number Search:
This test uses a simple brute force prime number finding algorithm. It begins at 3 and checks every integer to see if it is a member of the set of primes. (A prime number is one which is divisible only by 1 and itself). The test reports the amount of primes found and the largest prime. Note that for longer test periods, the rate of Primes Per Second found will drop as the distance between primes gets larger.
- Sorting Random Strings:
The test uses qsort to continually sort 1000 strings of 256 characters. Once the test duration expires, the test reports the speed of the sorting in thousands of strings per second.
- Compression:
The Compression test uses an Adaptive encoding algorithm based on source code from Ian H. Witten, Radford M. Neal, and John G. Cleary in an article called “Arithmetic Coding for Data Compression”. The system uses a model which maintains the probability of each symbol being the next encoded. It reports a compression rate of 363% for English text, which is slightly better than the Huffman method. This test reports its results in KBytes/Sec compressed.
- Encryption:
The encryption test uses the Blowfish enciphering algorithm. It is based on the C implementation by Paul Kocher. Data is enciphered using a 16byte key in blocks of 4 KB. The test reports in KBytes/Sec.
- Rotation:
The rotation algorithm is a PassMark developed algorithm using standard rotation mathematics. The test uses a 400 x 400 pseudo image with one byte of data per pixel. The image is rotated degree by degree, with each degree counting as one rotation. The test reports in rotations per second.
- MMX Addition:
- MMX Multiplication:
These are the standard PassMark benchmarks. See MMX Tests for more information. These tests are only included with the version of PT that is for the 32-bit version of Windows.
- Maths Integer addition:
This is a standard PassMark benchmark. See Maths Tests for more information.
- Whetstone:
The Whetstone benchmark is one commonly used to test floating point arithmetic. The algorithm is based on the original C source code written by Rich Painter. The benchmark is designed to test the speed of commonly used floating point CPU instructions. The test reports in MIPS (Million Instructions Per Second.)
- Dhrystone:
The Dhrystone benchmark is one commonly used to test a machines integer arithmetic. The algorithm is based on the C source code for Dhrystone version 2 by Reinhold P. Weicker. The test reports in MIPS.
- Memory Read:
- Memory Write:
These are the standard PassMark benchmarks. See Memory Tests for more information.
- Disk Access:
This test uses the same test engine as the PassMark Advanced Disk Test. The test uses a file size of the current available RAM, a block size of 4K, the Win32 uncached interface, a 50%/50% RW level, it is 100% Sequential and executed in Synchronous mode. The test reports its results in MB/Sec.
8. Prime95
Prime95 is basically a Mersenne prime number discovery program. It's a great example of Distributed Computing, but it's most loved by overclockers for its powerful system stress-testing and benchmarking abilities. It can torture-test your CPU to produce its maximum heat or spit out any errors due to excessive overclocking. Also, using the blend test, it can consume all your physical memory and run error-checking tests on your modules to ensure their quality. However, right now, we're mostly interested in it for its benchmarking capabilities.
Here are the times for the Intel Pentium 4 660, 650 and AMD Athlon 64 3800+ (less is better).

There is a huge difference between the Intel and AMD processors.
9. Encoding
Benchmarks are good for reference and comparison, but what about real life performance? For this reason, we ran some simple tests using popular utilities that most users use every day.
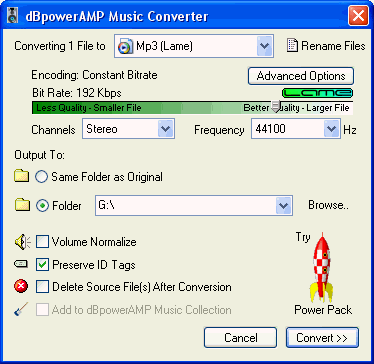
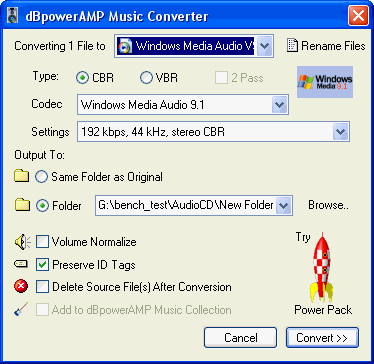
dBPower Tests
In the following graph, you can see how the three CPUs performed while encoding the same audio file into different formats. For this we used a whole music CD with a size of 750MB. We ripped the AudioCD using EAC and then with dBPower, we encoded from one format to another. The times needed for each task are given below (the lower, the better of course :-).
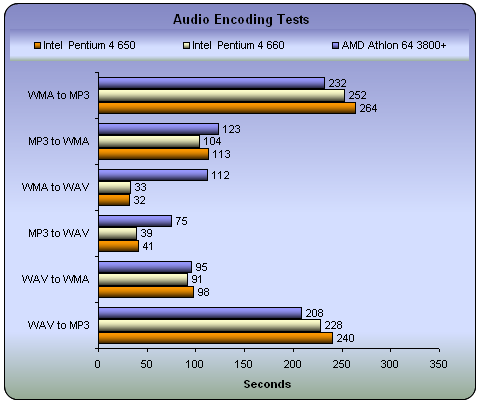
The AMD 3800+ maintains its supremacy with WMA to MP3 and WAV to MP3 conversions. In all other tasks, the Intel CPUs were faster.
The settings for dBPower were the same for all CPUs. Analytically:
DVD Shrink Tests
Compressing a movie from DVD9 to DVD5 is a very common task. For this task we ripped an original movie (which we own of course :-), using DVD Decrypter. Then, with DVD Shrink we compressed it to fit it on a DVD5 disc. The size of the original movie was 6.85GB and we compressed it down to 4.463GB. Below you can see how many frames per second each CPU can process and the total time needed for the encoding.

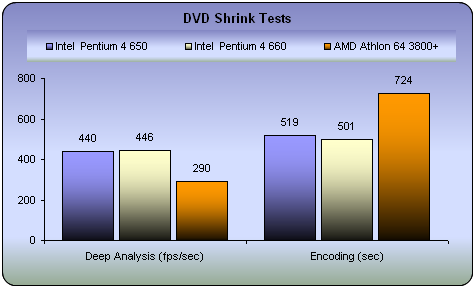
The Intel P4 650 and 660 can process almost the same number of frames per second during the Deep Analysis while the difference in encoding time between them is only 18 seconds. In contrast, the AMD process is left far behind in this task.
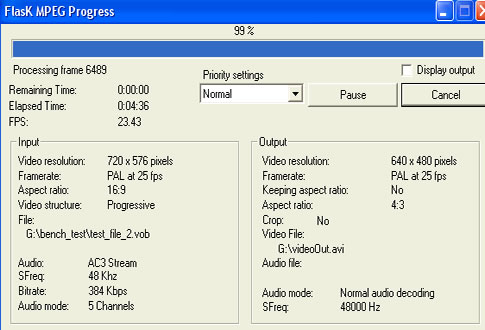
DivX Tests
Another very common task is to convert a movie to the DivX format. For this we used a .vob file, sized 202MB which with FlaskMPEG was converted to .avi. The settings are given below:

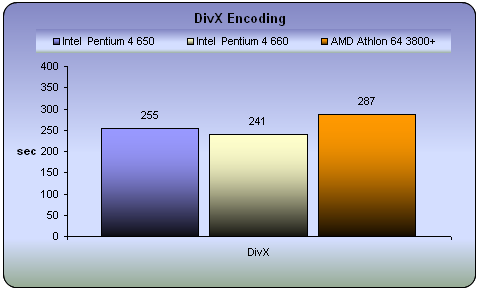
The 660 is still the fastest but the 650 follows with a small difference of only 14 seconds.
WinRAR Tests
Using a folder with 101MB of various data, we checked how much time each of the CPUs needed to compress and extract the data.
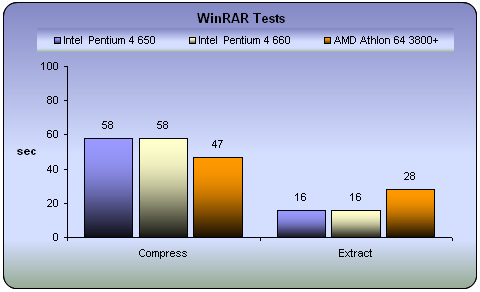
When compressing, the AMD is still fastest but quite a bit slower when decompressing. Again, similar performance from the Intel processors in both compression or extraction.
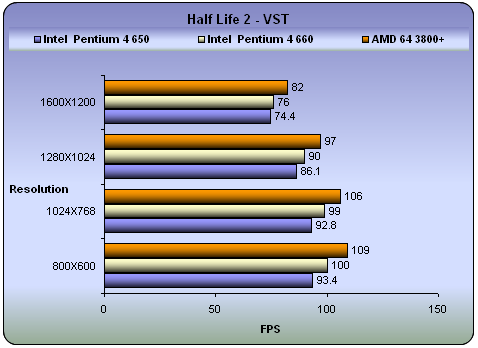
10. Games
Half life 2 is without doubt the most anticipated PC game of all time. Gamers having the excellence of Half Life 1 in mind, as well as the remarkable E3 demo preview, have been anxiously waiting for the much delayed release of HL2.
 Physics - From pebbles to water to 2-ton trucks respond as expected, as they obey the laws of mass, friction, gravity, and buoyancy.
Graphics - Source's shader-based renderer, like the one used at Pixar to create movies such as Toy Story® and Monster's, Inc.®, creates the most beautiful and realistic environments ever seen in a video game.
AI - Neither friends nor enemies charge blindly into the fray. They can assess threats, navigate tricky terrain, and fashion weapons from whatever is at hand.
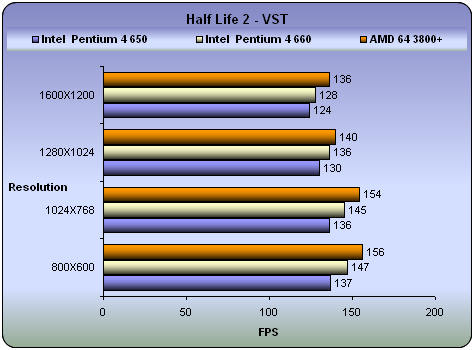
As we have seen time and time again, gaming is a field where there is no rival for the AMD processors. The 3800+ reported around 10fps higher framerates than the 660 and 20fps than the 650 at all resolutions.

A massive demonic invasion has overwhelmed the Union Aerospace Corporations’ (UAC) Mars Research Facility leaving only chaos and horror in its wake. As one of the few survivors, you struggle with shock and fear as you fight your way to Hell and back, in an epic clash against pure evil.
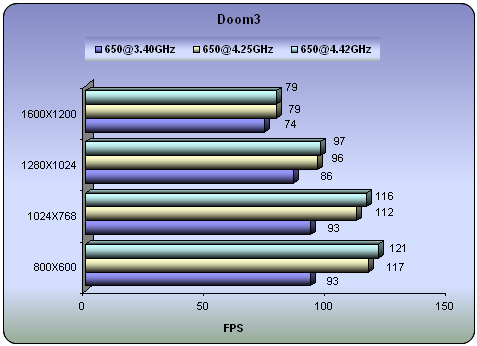
Activision made it's miracle again with Doom 3 which is said to be the best-looking game ever, thanks to the brand-new OpenGL graphics engine used to generate its convincingly lifelike, densely atmospheric, and surprisingly expansive environments. If you are a fan of the previous Doom games then you will get many flashbacks with this revision, since you will find reimagined versions of almost every monster from both Doom and Doom II.

To measure performance on the game we used the timedemo demo1 command from the console (Alt+Ctrl+~).
Enabling the high quality setting and executing the timedemo demo1 command twice for each resolution, we witnessed the following:
Still better performance from the AMD 3800+.
11. Overclocking
In order to overclock the CPU, we manually increase the FSB a step at a time, beginning from the default 200.
|
| The default clocks... |
We increased the FSB up to 250 where the system had no problems at all. In order to do this we also increased the voltage up to 1.5v. The higher speeds, produced as a result the famous blue screens or restarts. Our Benchmarks helped us at this point.
 |
| With FSB set to 250... |
We then decided to experiment with a third party cooling system. The Arctic-Cooling Freezer 7 PRO made things better. Now the CPU could run at 4.42GHz without a single problem.
 |
| With FSB set to 260... |
With the SpeedFam v4.27 utility, we checked the processor's temperature levels.
 |
| ...48~67°C from idle to full load... |
 |
| ...and 2625~2740rpm for the stock cooler fan... |
 |
| ...full load when running at 4.42GHz... |
The new generation 64 bit 6xx with 2MB L2 cache produce higher temperature levels. During idle, the reported temperature was close to 49°C while under full load, it increased to 67°C. The rotation speed of the stock cooler fan was close to 2625~2740rpm, without any significant increase under high temperatures. The voltage for the CPU was close to 1.425v. When we tried to increase it to 1.5v, just to see how the stock cooler would perform at such high voltage, the reported temperature for the same test was close to 75°C under full load.
- The Tests

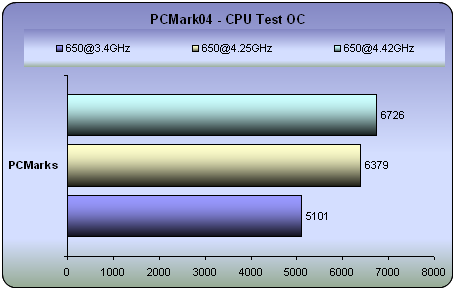
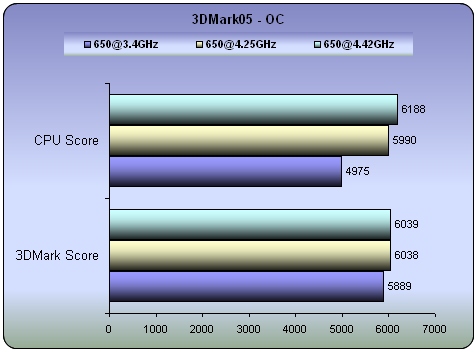
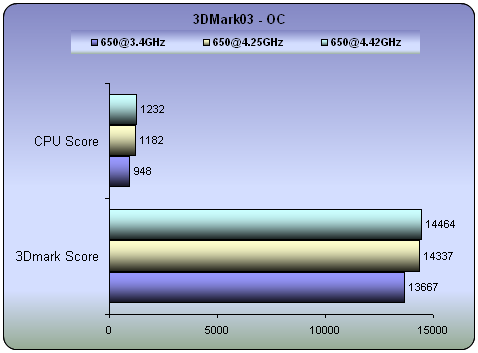
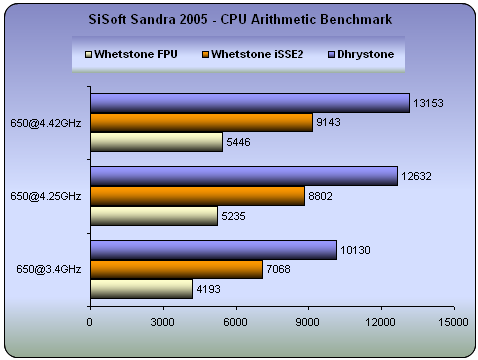
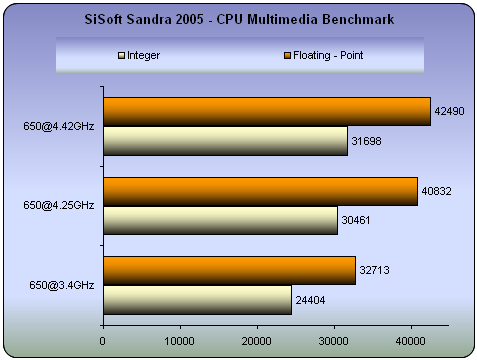
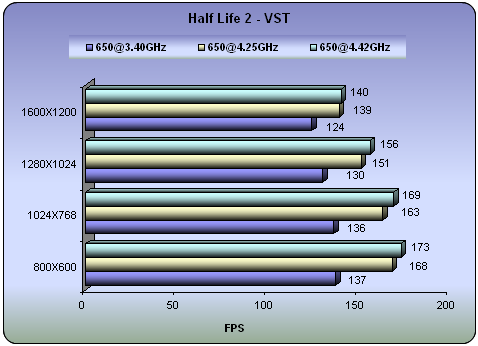
The increased clocks boosted performance. No matter what the task, the 4.42GHz made a difference, even with games.
12. Conclusion

The P4 650 3.4Ghz had very good overall performance, as was evident in our tests, although naturally so, lower performance than the 660 3.6GHz. The CPU tests from PCMark or 3DMark reported that the 650 was better in many of the tests than the 3800+ from AMD. Audio, Video and DivX conversion are still some of the strong features of the Intel processors while in the case of games, AMD holds first place. However, in the case of overclocking, the 650 is to be extremely good. Even with the stock cooling system in place, you can easily ramp the clock up to 4.25GHz or if you choose a more efficient cooler, you can reach 4.42GHz.

The price of the Pentium 4 650 retail package is close to US$268 from newegg.com, while for an AMD 3800+ you'll need US$289 and for the 660, up to US$410. The price is rather good for what the CPU offers. Good overall performance with excellent overclocking ability make the P4 650 3.4GHz a good choice.