Tablet Market Keeps Shrinking
Consumer spending during the holiday quarter of 2016 was not aimed at consuming tablets as the market continued its spiraling decline.
The fourth quarter of 2016 (4Q16) marked the ninth consecutive quarter that tablet shipments have declined. According to preliminary data from the International Data Corporation (IDC), vendors shipped 52.9 million tablets in the fourth quarter, which was a decline of 20.1% from the same quarter one year ago. Similarly, shipments of 174.8 million units for the full year 2016 were down 15.6% compared to 2015, marking the second straight year of declining shipments.
"The sentiment around the tablet market continues to grow stale despite a lot of talk about vendors pivoting their product portfolios toward the detachable segment," said Ryan Reith, program vice president with IDC's Worldwide Quarterly Mobile Device Trackers. "Typical tablets without a dedicated keyboard, which IDC refers to as slate tablets, are continuing to lose relevancy across all regions and, as a result, we see the decline happening globally. We do see future growth in some emerging markets like the Middle East & Africa as well as Central & Eastern Europe with the sole catalysts being simplicity and low cost. Unfortunately for the industry these are the devices that don't equate to large revenues."
Vendors that have historically led the notebook PC market are also talking about expanding their product portfolios to include more detachable tablets, although currently there is more talk than action. As a result, Apple and Microsoft are dominating the detachable tablet segment. IDC believes the second half of 2017 will bring a wide range of new detachable devices from the notebook PC OEMs as well as those playing primarily in the smartphone space.
Yet even detachable tablets struggled to maintain momentum in the fourth quarter as flagship products from key players like Microsoft and Apple started to show signs of age.
| Top Five Tablet Vendors, Shipments, Market Share, and Growth, Fourth Quarter 2016 (Preliminary Results, Shipments in millions) |
||||||||||
| Vendor | 4Q16 Unit |
4Q16 Market |
4Q15 Unit |
4Q15 Market |
Year-Over- |
|||||
| 1. Apple | 13 | .1 | 24 | .7% | 16 | .1 | 24 | .3% | -18 | .8% |
| 2. Samsung | 8 | .0 | 15 | .1% | 9 | .0 | 13 | .6% | -11 | .4% |
| 3. Amazon.com | 5 | .2 | 9 | .7% | 5 | .2 | 7 | .8% | -0 | .6% |
| 4. Lenovo | 3 | .7 | 7 | .0% | 3 | .2 | 4 | .9% | 14 | .8% |
| 5. Huawei | 3 | .2 | 6 | .0% | 2 | .2 | 3 | .4% | 43 | .5% |
| Others | 19 | .8 | 37 | .4% | 30 | .5 | 46 | .0% | -35 | .1% |
| Total | 52 | .9 | 100 | .0% | 66 | .2 | 100 | .0% | -20 | .1% |
| Source: IDC Worldwide Quarterly Tablet Tracker, February 2, 2017 | ||||||||||
Apple's venerable hold on the tablet market is yet to be challenged although the company is not immune to overall market challenges, declining 18.8% in 4Q16. The iPad Pro lineup made up only a small portion of overall shipments as the iPad Air 2 and Mini tablets continued to account for the majority of the shipments for Apple. For every 10 slate tablets shipped, Apple only sold 1 iPad Pro tablet.
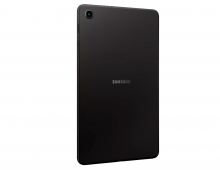
Samsung remained the number two tablet vendor in the holiday season capturing 15.1% market share on 8 million shipments. The bad news is that this was down -11.4% from the holiday quarter in 2015. The Tab S2 and Tab A continue to be the strongest models for Samsung and its largest markets for tablet consumption continue to be the United States, Europe, and Asia/Pacific (excluding Japan).
Amazon's Fire tablets continued their hot streak, earning the company third place overall in 4Q16. The already low cost tablets were further discounted during the Black Friday sales period although this was still not enough to stave off an annual decline. However, it is important to note that Amazon is in the unique position where tablet market share is likely not of significant importance as the company remains highly focused on acquiring additional Prime subscribers regardless of the type of device used.
| Top Five Tablet Vendors, Shipments, Market Share, and Growth, 2016 (Preliminary Results, Shipments in millions) |
||||||||||
| Vendor | 2016 Unit |
2016 Market |
2015 Unit |
2015 Market |
Year-Over- |
|||||
| 1. Apple | 42 | .6 | 24 | .4% | 49 | .6 | 23 | .9% | -14 | .2% |
| 2. Samsung | 26 | .6 | 15 | .2% | 33 | .4 | 16 | .1% | -20 | .5% |
| 3. Amazon.com | 12 | .1 | 6 | .9% | 6 | .1 | 2 | .9% | 98 | .8% |
| 4. Lenovo | 11 | .1 | 6 | .3% | 11 | .2 | 5 | .4% | -1 | .2% |
| 5. Huawei | 9 | .7 | 5 | .6% | 6 | .5 | 3 | .1% | 49 | .9% |
| Others | 72 | .7 | 41 | .6% | 100 | .3 | 48 | .4% | -27 | .5% |
| Total | 174 | .8 | 100 | .0% | 207 | .2 | 100 | .0% | -15 | .6% |
| Source: IDC Worldwide Quarterly Tablet Tracker, February 2, 2017 | ||||||||||
Lenovo was one of the two vendors to grow in the 4Q16 and managed to gain 2.1 percentage points in 4Q16 over the same period in 2015. With a broad lineup and innovative designs, IDC expects this vendor will be one to watch in 2017.
Outside of price, Huawei's value proposition is cellular connectivity and this was evidenced in their portfolio as the majority of their tablets offered built-in 3G or 4G connectivity. To date, the Chinese company has done well in expanding their reach to Asian, European, and Middle Eastern markets, though their tablet presence in the U.S. is close to non-existent.


