AMD 4200+ X2
4. PCMark04 - 05
PCMark04 and 2005 are application-based benchmarks and a premium tool for measuring overall PC performance. They use portions of real applications instead of including very large applications or using specifically created code. This allows them to be smaller installations as well as to report very accurate results. As far as possible, PCMark04 and 2005 use public domain applications whose source code can be freely examined by any user.
Both PCMark04 and PCMark05 include 4 categorized suites for benchmarking your computer. These include CPU, Graphics, Memory and a Hard Disk Drive benchmark. In our case, we selected only the CPU test suite.
- PCMark2004
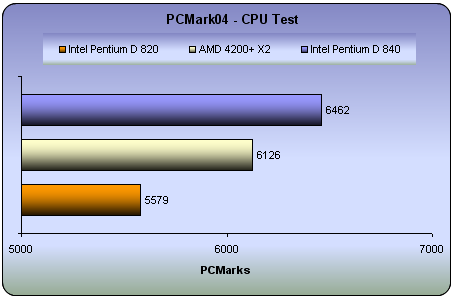
According to PCMark04, the performance of the AMD 4200+ X2 Dual Core processor is placed somewhere in the middle, between the D 840 and D 820. As you can see in the following table, with the test results presented analytically, there are tasks where the 4200+ is faster than the D 840, while in others, closer to the D 820.
| D 820 | 4200+ X2 | D 840 | |
| File Compression (MB/sec) | 6.0 | 6.1 | 6.9 |
| File Encryption (MB/sec) | 80.4 | 68.2 | 92.3 |
| File Decompression (MB/sec) | 55.5 | 55.4 | 64.0 |
| Image Processing (MPixels/sec) | 23.8 | 27.1 | 27.6 |
| Grammar Check (KB/sec) | 4.1 | 6.1 | 4.8 |
| File Decryption (MB/sec) | 79.9 | 67.8 | 91.9 |
| Audio Conversion (KB/sec) | 2183.0 | 2925.9 | 2508.0 |
| WMV Video Compression (FPS) | 63.6 | 80.6 | 75.8 |
| DivX Video Compression (FPS) | 76.8 | 84.0 | 88.0 |
- PCMark2005
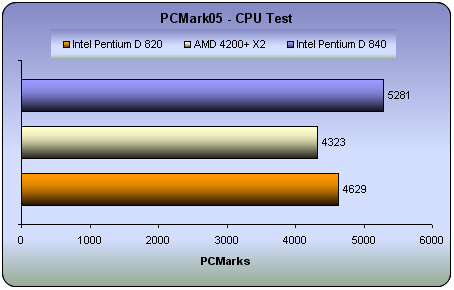
According to the PCMark2005 benchmark, the Intel processors are more powerful than the AMD. However, as you will notice in the table below, in many tasks, the AMD is far superior as is the case with File Compression and Decompression or Audio Compression. In the first Multithreaded test, none of the three processors lost in performance due to multithreading, compared to the same tests without multithreading. In the second Multithreaded test, all three processors halved in performance with all four threads running.
| D 820 | 4200+ X2 | D 840 | |
| File Compression (MB/sec) | 7.276 | 8.512 | 8.090 |
| File Decompression (MB/sec) | 110.438 | 131.572 | 128.221 |
| File Encryption (MB/sec) | 63.862 | 41.833 | 73.528 |
| File Decryption (MB/sec) | 61.808 | 37.724 | 70.689 |
| Image Decompression (MPixels/sec) | 22.633 | 25.333 | 25.991 |
| Audio Compression (KB/sec) | 1835.877 | 2499.359 | 2117.081 |
| Multithreaded Test 1 | |||
| File Compression (MB/sec) | 7.270 | 8.531 | 8.012 |
| File Encryption (MB/sec) | 63.504 | 42.008 | 73.385 |
| Multithreaded Test 2 | |||
| File Decompression (MB/sec) | 55.681 | 65.843 | 63.249 |
| File Decryption (MB/sec) | 30.634 | 19.000 | 35.716 |
| Audio Decompression (KB/sec) | 888.453 | 999.819 | 1003.015 |
| Image Decompression (MPixels/sec) | 11.363 | 12.772 | 12.895 |
The conclusion we can come to, looking at the above table is that with the single thread applications, only one of the two cores is used. With Multithread Test 1 where two threads are running, one thread is handled by each core. When we go to the Multithreaded Test 2, each core must now handle 2 threads which is why we get approximately half the performance of the single thread tests.


