ASUS CT-479
3. Performance
In this page, we will be looking at the results of a wide variety of CPU related tests carried out on the CT-479 Adapter and Pentium M 735 CPU. Note here, that the comparison with the Pentium Prescott 2.8 CPU is presented for reference reasons, as a gauge, and not as a direct comparison of the two CPUs since we're discussing two totally different technologies.
-Passmark
![]()
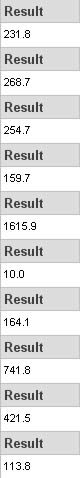
The suite of PassMark Performance Tests contains multi-process CPU tests such as:
- Integer (32-bit addition, subtraction, multiplication and division)
- Floating Point (32-bit addition, subtraction, multiplication and division)
- WIN32: MMX (matrix multiplication) or WIN64: 64bit Integer Matrix Multiplication
- WIN32: SSE (128-bit SSE operations such as addition, subtraction and multiplication) or WIN64: 64bit Floating Point Matrix operations
- WIN32: 3Dnow! (3D transformation of an array of 32-bit vertices) or WIN64: 64bit Floating Point Matrix operations
- Compression
- Encryption
- Image Rotation (Rotate image co-ordinates in memory)
- Random String Sorting
Integers are whole numbers such as 23, 459532, -26. Floating point numbers contain a fractional part, e.g. 1.003, 98394.2. These two types of numbers are treated quite differently inside a CPU, which is why PerformanceTest differentiates between the two.
For each of the integer tests, a large array of random 32 bit integers is processed using the particular mathematical operations listed below. For the floating point tests, single precision floating point numbers (32 bit) are used.
The "PassMark rating" is a weighted average of all the other test results and gives a single overall indication of the computer's performance. The bigger the number, the faster the computer. The "PassMark rating" can only be calculated if the results from all other tests are available. The value is calculated as follows.
| Test Suite | Weighting |
| Disk | 20% |
| CD / DVD | 9% |
| Memory | 18% |
| 3D Graphics | 12% |
| 2D Graphics | 14% |
| CPU | 27% |
| Total | 100% |
In our case, we only ran the CPU test suite.

| Test | Pentium M | Pentium 2.8 |
 |
 |
 |
- 3DMark 05
![]()
With 3DMark05, Futuremark continues the tradition in its benchmarking software by providing a state-of-the-art Microsoft ® DirectX ® 9 3D performance benchmark.
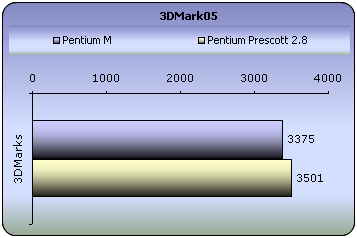
The total 3DMark05 score for the M series CPU was 3375Marks against 3501Marks for the Prescott 2.8 CPU. The difference is not that great, mostly because these tests are GPU dependent. Both systems use an Nvidia based chipset graphics card, the 6600GT AGP.
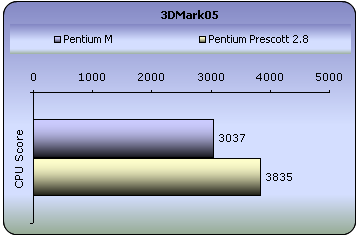
3037 marks for the M 735 CPU and CT-479 Adapter.
- PCMark05
PCMark04 and 2005 are application-based benchmarks and a premium tool for measuring overall PC performance. It uses portions of real applications instead of including very large applications or using specifically created code. This allows PCMark04 to be a smaller installation as well as to report very accurate results. As far as possible, PCMark04 uses public domain applications whose source code can be freely examined by any user.
Both PCMark04 and PCMark05 include 4 categorized suites for benchmarking your computer. These include CPU, Graphics, Memory and a Hard Disk Drive benchmark. In our case, we selected only the CPU test suite on PCMark 05.

- HL2
Half life 2 is without doubt the most anticipated PC game of all time.

Physics - From pebbles to water to 2-ton trucks respond as expected, as they obey the laws of mass, friction, gravity, and buoyancy.
Graphics - Source's shader-based renderer, like the one used at Pixar to create movies such as Toy Story® and Monster's, Inc.®, creates the most beautiful and realistic environments ever seen in a video game.
AI - Neither friends nor enemies charge blindly into the fray. They can assess threats, navigate tricky terrain, and fashion weapons from whatever is at hand.

Surprising outcome, with the M 735 CPU producing better framerates than the Pentium processor. It could be due to the 2MB cache on the M 735 compared to 1MB cache on the Prescott CPU.
- SpeedFan
To measure the CPU's temperature, we used SpeedFan v4.28 which provided us with real time monitoring and created a graph of the temperature over time. After letting the processor settle down in idle mode, we fired up Prime95 and ran the in-place large FFT test to heat it up to its maximum level. The following is the graph of the temperature with the stock cooler and Prescott CPU.

As we can see in the above graph, the temperature in idle mode is at 34-35°. Upon firing up the prime95 torture test, the temperature reaches all the way up to 43°.
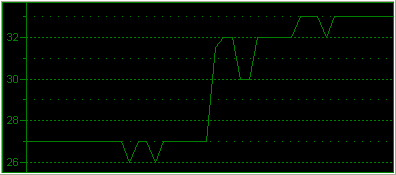
Now notice the temperature differences with the M series CPU and the CT-479 Adapter. The temperature in idle mode starts at 27° and with the Prime95 torture test fired up, the temperature rises up to 33°. Very low temperatures for a CPU, even at 1.7GHz. Note also, that you can install any off the market cooler solution on the CT-479 adapter, providing even lower temperatures.
Overall, we were glad to see the CPU achieving a steady performance without producing any significant amount of noise (the stock cooler functions with low RPMs due to the low temperatures with the M series CPU). The CT-479 performs as intended.