Kingston SSDNow V300 120GB review
3. HDTune benchmark
Here is our testbed:
- Motherboard: Foxconn Quantum Force Rattler P67 vP04 BIOS
- Processor: Intel Core i5-2500K
- Case: Open Air testbed
- Power Supply Unit: Club 3D CSP-X1000CB 1000 Watt
- Graphics card: Club3D Radeon HD 6790 CoolStream Edition
- Memory: OCZ Gold PC3-10600 4x2GB 1333@CL9
- HDD: WD 500GB 7200RPM
- Monitor: LG L246WH-BH 24"
- Windows 7 x64 SP1 with latest updates installed
For the tests, we used the following software:
- HDTachRW v3.0.1.0
- HD Tune v4.50 Pro
- Crystal DiskMark v3
- ATTO Disk Benchmark v2.46
- ASS SSD Benchmark 1.5xxx
- IOMeter v2006.07.27 with Xtreme Benchmark template
- PCMark Professional edition v1.04
- Anvil Storage Utilities 1.0.34. Beta 11
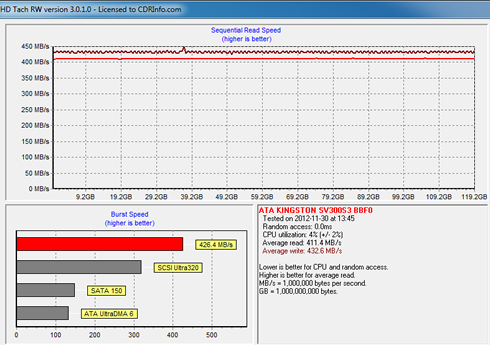
We start the tests with the HDTachRW software. It shows the potential read speed which you are likely to experience with the SSD. The software measures the sequential read speed, the random access speed and sequential write speed.
The reported average sequential writing speed was 432.6 MB/s and the average sequential reading of 411.4 MB/s are close to the typical figures quoted by Kingston (450 MB/s.)
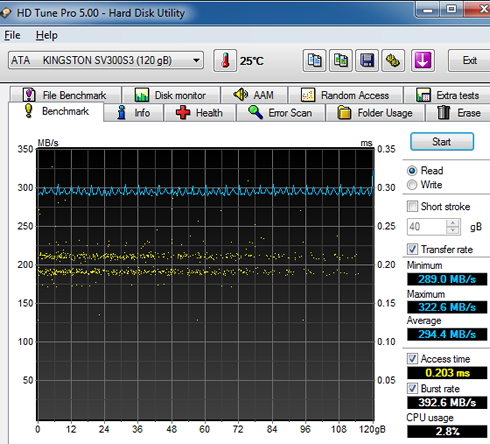
We move on to the HD Tune Pro software, another utility we used to measure the drive's reading and writing performances. Although not necessarily representative of real-world workloads, HD Tune's targeted tests give us a glimpse of each drive's raw capabilities.
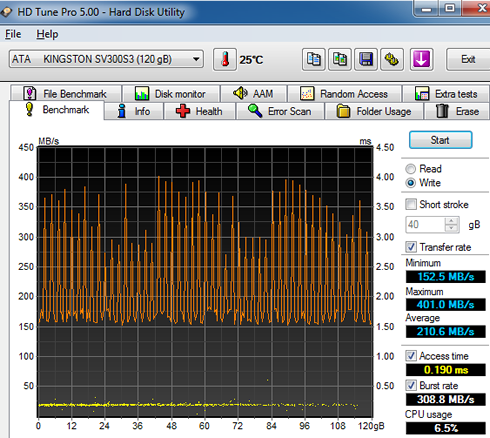
This time the sequential reading test showed a 294.4 MB/s average speed and the corresponding sequential writing test a 210.6 MB/s average, which are both lower than we expected:
As you see in the screenshot below, writing was not stable across the data sequence and the reading speed was peaking at around 401.1 MB's. This behavior is attributed to the was the specific benchmark operates.
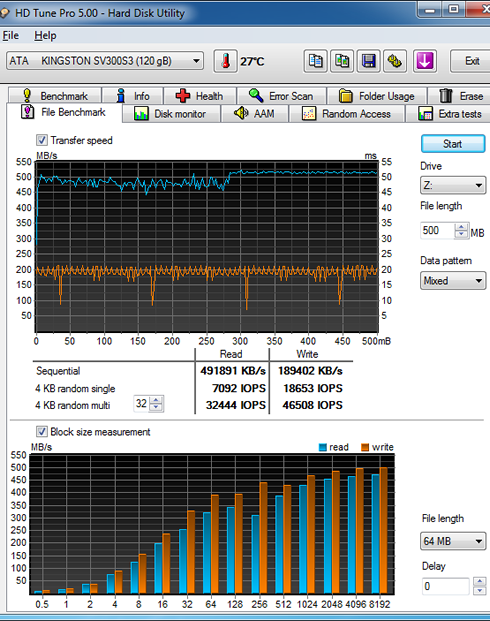
HD Tune's file benchmark consists of two parts: the transfer speed test and block size test. The transfer rate test measures three different parameters for both reading and writing:
- Sequential: the sequential speed is measured and shown on the graph. Ideally the transfer speed line should be straight and smooth.
- 4 KB random single: this test measures the performance of I/O operations of 4096 byte blocks - the most common I/O operation on a typical system. Especially the 4 KB write speed is an important indication of general system performance.
- 4 KB random multi: this test is similar to the 4 KB random single test except that multiple requests are sent simultaneously to the device. We set the number of operations to 32.
There are also three data patterns available that can be used during the write process: zero, random and mixed, which is a combination of zeroes and random data.
Certain
SSDs use a compression technique which improves performance when compressible data is
used.
For these devices the results will be highest when writing zeroes and lowest when writing
random data.
Let's start with a sequential transfer speed of a 500MB file using zeros in the writing part:
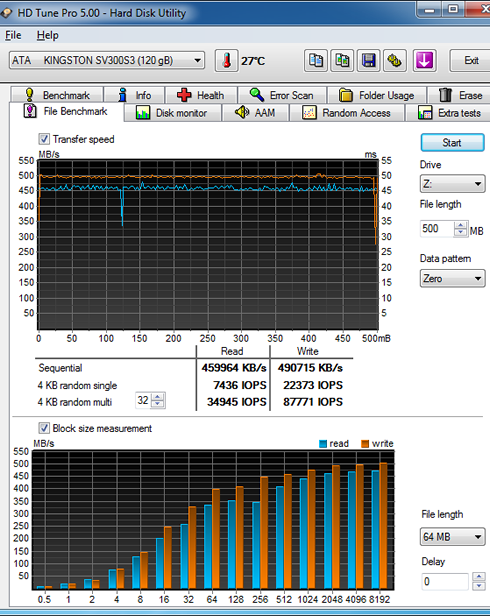
The Kingston drive read the 500MB file at an average speed of 459.9 MB/s and wrote the file at 490.7 MB/s - pretty fast in both cases. The 4K random single performance with 4096 byte blocks was 7436 IOPS for reading and 22373 IOPS for writing. When we enabled the 32 requests option, both figures were boosted at 34945 IOPS and 87771 IOPS, respectively.
Selecting the "Random" data pattern (zeroes and data) had no serious impact to drive's sequential read performance but influenced the drive's write performance, which was decreased at 166.543 MB/s
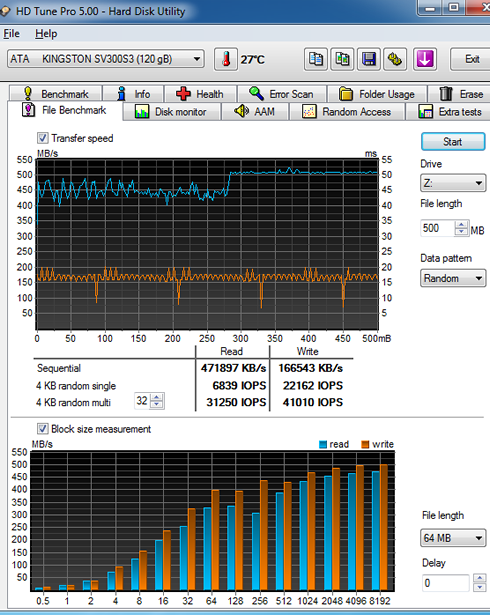
The reading result with a "mixed" data pattern was very high. In the writing part, the drive was again slower than at the "zero" pattern test, due to its compression algorithm:
