Asus Xonar D2
8. Conclusion
An important question is whether the Asus Xonar D2 offers any improvements, compared with the on-board soundcard. For that purpose, we used the external recording mode on both the Asus Xonar D2 and the SoundMax HD Audio sound cards (3.5mm jack male-to-male).
Starting from CD quality, we see a clear advantage in the Asus Xonar D2 in the Noise/Dynamic Range, and of course THD scores :
| RMAA v6.0.5 Comparison Test Results | ||
| Testing 16bit/44.10KHz | ASUS Xonar D2 Audio | SoundMAX HD Audio |
| Frequency response (from 40 Hz to 15 kHz), dB: | +0.05, -0.04 | +0.26, -0.07 |
| Noise level, dB (A): | -96.3 | -88.8 |
| Dynamic range, dB (A): | 96.5 | 87.4 |
| THD, %: | 0.0005 | 0.0092 |
| IMD + Noise, %: | 0.0042 | 0.047 |
| Stereo crosstalk, dB: | -97.3 | -88.9 |
| RMAA v6.0.5 Comparison Test Results | ||
| Testing 16bit/48.0KHz | ASUS Xonar D2 Audio | SoundMAX HD Audio |
| Frequency response (from 40 Hz to 15 kHz), dB: | +0.06, -0.04 | +0.11, -0.03 |
| Noise level, dB (A): | -97.0 | -88.7 |
| Dynamic range, dB (A): | 97.0 | 87.7 |
| THD, %: | 0.0006 | 0.0092 |
| IMD + Noise, %: | 0.0039 | 0.015 |
| Stereo crosstalk, dB: | -96.8 | -87.7 |
| RMAA v6.0.5 Comparison Test Results | ||
| Testing 16bit/96.0KHz | ASUS Xonar D2 Audio | SoundMAX HD Audio |
| Frequency response (from 40 Hz to 15 kHz), dB: | +0.07, -0.05 | +0.02, -0.06 |
| Noise level, dB (A): | -99.7 | -88.8 |
| Dynamic range, dB (A): | 100.1 | 87.7 |
| THD, %: | 0.0008 | 0.0091 |
| IMD + Noise, %: | 0.0028 | 0.014 |
| Stereo crosstalk, dB: | -98.8 | -85.4 |
At the best quality for 16bit, the performance differences are even clearer:
| RMAA v6.0.5 Comparison Test Results | ||
| Testing 16bit/192.0KHz | ASUS Xonar D2 Audio | SoundMAX HD Audio |
| Frequency response (from 40 Hz to 15 kHz), dB: | +0.08, -0.05 | +0.04, -0.17 |
| Noise level, dB (A): | -103.0 | -89.0 |
| Dynamic range, dB (A): | 103.0 | 87.8 |
| THD, %: | 0.0013 | 0.0092 |
| IMD + Noise, %: | 0.0023 | 0.014 |
| Stereo crosstalk, dB: | -99.9 | -84.1 |
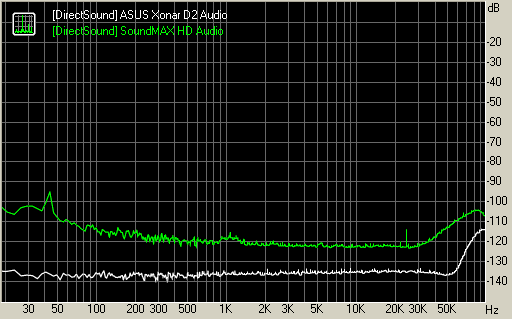
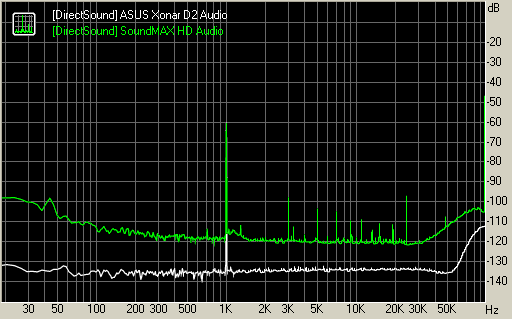
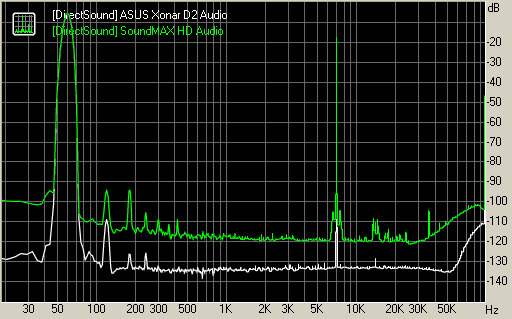
And the following graphs show the differences:
Frequency response graph

Noise level graph

Dynamic range

Intermodulation distortion graph
THD + Noise (at -3 dB FS) graph:


