Facebook Shares COVID-19 Symptom Maps, Expands Survey Globally to Help Predict Disease Spread
Facebook produced its first report and new interactive maps based on a US symptom survey , which the company plans to update daily through the COVID19 outbreak.
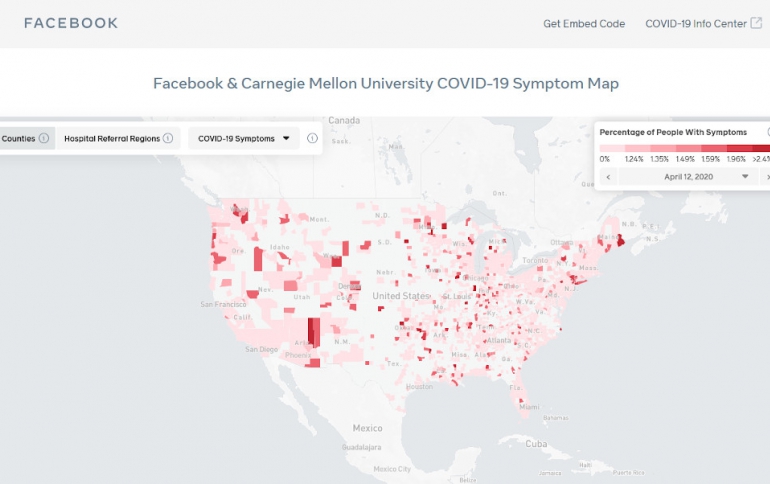
Today the Carnegie Mellon University (CMU) Delphi Research Center made public the initial results of their US symptom survey promoted on Facebook. Using aggregate data from Carnegie Mellon, Facebook produced a report and new interactive maps. Mark Zuckerberg wrote in the Washington Post about how surveys like this can be an important tool in fighting COVID-19 and announced that Facebook is working with faculty from the University of Maryland to expand the program globally.
"As the world fights covid-19 and countries develop plans to reopen their societies, it’s critical to have a clear understanding of how the disease is spreading. Better data can help governments determine where to send resources such as ventilators and personal protective equipment — and eventually which areas are safe to start opening up again," Zuckerberg wrote.
Facebook recently started showing the Facebook community in the United States an opt-in symptom survey run by health researchers at Carnegie Mellon University. The survey asked people if they have symptoms such as fevers, coughing, shortness of breath or loss of smell that are associated with covid-19. Since experiencing symptoms is a precursor to becoming more seriously ill, this survey can help forecast how many cases hospitals will see in the days ahead and provide an early indicator of where the outbreak is growing and where the curve is being successfully flattened. The survey responses are sent to the researchers and aren’t accessible to Facebook.
The team at Carnegie Mellon published its initial findings. They’re getting approximately 1 million responses a week in the United States, and the results are promising. They correlate with publicly available data on confirmed cases, which suggests this data can help predict where the disease will spread. They can also be used to build detailed county-by-county insights. The results indicate, for example, that in some New York City suburbs, an estimated 2 to 3 percent of people are experiencing covid-19-like symptoms. Using aggregate data from Carnegie Mellon’s results, Facebook produced its first report and new interactive maps.
Facebook is partnering with faculty from the University of Maryland to expand this survey globally, and the team at Carnegie Mellon is building an application programming interface, or API, that will let researchers everywhere access the results.
Facebook has also partnered with researchers from New York University and the Mila research institute in Montreal, using artificial intelligence to help hospitals better predict needs for scarce resources, such as personal protective equipment and ventilators.
Zuckerberg added:
"Since we’re all generating data from apps and devices every day, there will likely be many more opportunities to use the aggregate data to benefit public health. But it’s essential that this is done in a way that protects people’s privacy and respects human rights.
It’s important that organizations involved in this work commit to doing it in a way that protects people’s information and that any data collected is used solely for responding to public health emergencies and for other crisis response efforts. Fighting the pandemic has required taking unprecedented measures across society, but it shouldn’t mean sacrificing our privacy".

