Facebook And Android Top Digital Trends For 2014
Digital was top of a lot of marketers' and consumers' minds this year and Nielsen looked at some of the top trends in digital including the latest top U.S. smartphone apps and operating systems.
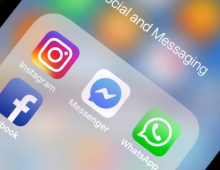
Consumers seemed to place a premium on the Internet's social space this year, with a big portion of the top smartphone apps centered on connectivity-be it with friends, loved ones or cat videos. According to Nielsen's data, the app with the most year-over-year change was one designed to continue the conversation: Facebook Messenger use has risen 242% since 2013. Facebook held the No. 1 ranking as well with its social network app, which had over 118 million average unique users each month. Google Search came in second with about 90 million average unique users, followed by YouTube with 88 million average unique users.
| Rank | App | Avg Unique Users | YoY % Change |
|---|---|---|---|
| 1 | 118,023,000 | 15 | |
| 2 | Google Search | 90,745,000 | 14 |
| 3 | YouTube | 88,342,000 | 26 |
| 4 | Google Play | 84,968,000 | 11 |
| 5 | Google Maps | 79,034,000 | 26 |
| 6 | Gmail | 72,405,000 | 8 |
| 7 | Facebook Messenger | 53,713,000 | 242 |
| 8 | Google+ | 48,385,000 | 78 |
| 9 | 43,944,000 | 34 | |
| 10 | Music (iTunes Radio/iCloud) | 42,546,000 | 69 |
| Source: Nielsen. Note: The list is ranked on average unique audience, which is the average of January 2014-October 2014. The year-over-year percent change represents the unique audience of October 2014 compared to the unique audience of October 2013. | |||
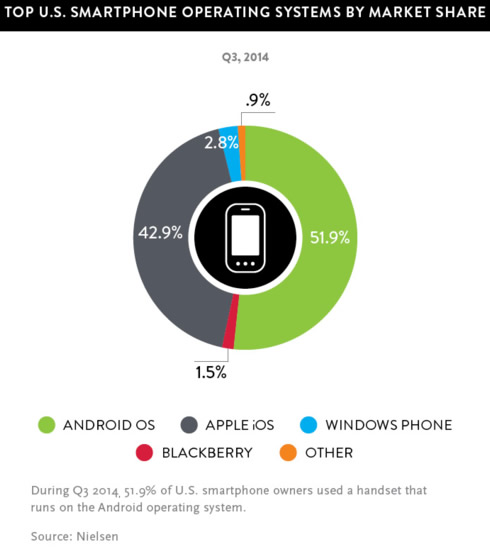
Smartphone penetration grew from 69% at the start of 2014 to 76% of U.S. mobile subscribers by October 2014, and a majority of subscribers used Android (52%) and iOS (43%) devices to access their apps. Three percent of U.S. smartphone owners used a handset that operated on a windows phone, followed by 2% on a Blackberry.