Memorex M-Flyer & TravelDrive
4. Performance
In order to test the performance of each of the USB memory sticks, we used two well known becnhmarking utilities, HD Tach and Sisoft Sandra 2005. All tests were carried out under WinXP with a USB 2.0 compatible motherboard (Abit A8N Fatal1ty series).
HD Tach Results
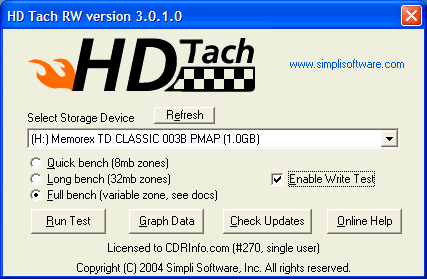
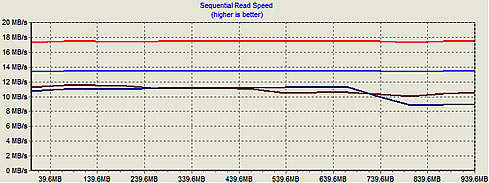
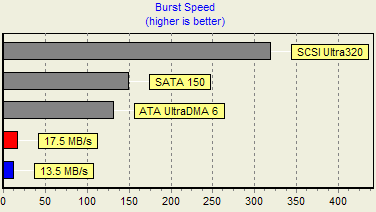
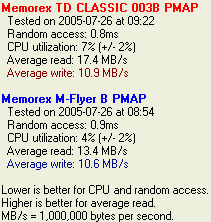
Surprisingly enough, the Memorex TD (TravelDrive) Classic, reported higher values than the M-Flyer which we expected to be faster. In reading, the TD Classic reported 17.4MB/s while the M-Flyer reported 13.4MB/s, while in writing, both were close and reported high speeds. Nice performance from both USB devices.
Sisoft Sandra 2005 SR1 Results
Sisoft Sandra has two series of tests.
The "File system" which tests how your drive(s) and controller(s) compare to other devices in a typical system:
· Read Test: Buffered, Random, Sequential
· Write Test: Buffered, Random, Sequential
· Seek Test
The "Drive Index" mark is a composite figure representing an overall performance rating based on the average of the read, write, and seek tests, and file and cache size. The Drive Index is intended to represent drive performance under typical use in a PC. A larger number means better performance. The weighting of the results is not equal and represents the distribution of different files sizes as used on these devices (obtained through field research).
| M-Flyer | |
| TravelDrive |
After our first tests above, we weren't surprised that the TD reported the highest Drive Index (15MB/s) while the M-Flyer weighed in at 12MB/s. This is because of the high reading speed of the TD.
The "Compact Flash" typical usage model for these devices is File operations, such as Writing a file to the device, reading a file from it, and deleting a file. This benchmark exercises the devices in terms of these operations (to measure the “raw” cluster level performance of the device, it is recommended to also test it by means of the File System Benchmark module). The following characteristics are measured for each of the four representative file sizes of 512 Bytes (representing a minimal single data cluster file), 32kB, 256kB and 2MB. The weighting of the results is not equal and it represents the distribution of different files sizes as used on these devices (obtained through field research). For each of the four file sizes, a Combined Index is then calculated, stating the combined performance in terms of Combined Operations Per Second, with respect to a mix of write, read and delete operations.
Combined Device Index: is a composite figure representing an overall performance rating based on the average of the Combined Index figures over the four file sizes. (Higher is better, i.e. better performance)
Endurance Factor: is a figure representing the Wear and Life Expectancy of flash devices; this is obtained by dividing the average performance (normal condition, i.e. sequential write) to the lowest performance (high-stress condition, i.e. same block re-write). It measures the relative improvement of endurance caused by the wear leveling or flash management algorithm; the absolute endurance of a device (i.e. its expected life-time) is directly dependent, in addition to this Endurance Factor, on the nominal manufacturer rating of maximum erase/reprogram cycles, which is typically 100,000+ for SLC and 10,000+ for MLC devices. (Higher is better, i.e. longer life-time for the device)
| M-Flyer | |
| TravelDrive |
The TD classic, once more achieved higher values in the combined index operations, keeping in line with higher performance ratings in the previous tests. The Higher Endurance Factor though was reported with the M-Flyer USB stick.
The Travel Drive Classic is a better performer, while the M-Flyer is more robust.


