PC Volumes Showed an Fourth Quarter Growth
The worldwide market for traditional PCs, inclusive of desktops, notebooks, and workstations, finished an impressive 2019 with fourth quarter growth of 4.8% year over year, according to preliminary results from the International Data Corporation (IDC).
Global shipments during the quarter beat forecast expectations at just under 71.8 million units, the highest single quarter shipment volume in four years (4Q15). Overall, global shipments grew 2.7% year over year in 2019, the first full year of PC growth since the market grew 1.7% in 2011.
"This past year was a wild one in the PC world, which resulted in impressive market growth that ultimately ended seven consecutive years of market contraction," said Ryan Reith, program vice president with IDC's Worldwide Mobile Device Trackers. "The market will still have its challenges ahead, but this year was a clear sign that PC demand is still there despite the continued insurgence of emerging form factors and the demand for mobile computing."
IDC says that the storyline in the commercial sector for most of the year was around the momentum driven by businesses transitioning PCs over to Windows 10 before the end of support for Windows 7 arrives in January 2020. The continued business push specifically helped the top 3 players – Lenovo, HP, and Dell – to further consolidate their hold on the market with a combined share of just over 65% in 2019 (up from 63% in 2018). In addition, the impact of several other market challenges declined in the quarter. Concerns about CPU availability continued but were helped by the adoption of AMD CPUs while signs of easing trade tensions and other industry drivers helped to increase market uptake for the most important quarter of the year.
"Despite the positivity surrounding 2019, the next twelve to eighteen months will be challenging for traditional PCs as the majority of Windows 10 upgrades will be in the rearview mirror and lingering concerns around component shortages and trade negotiations get ironed out," said Jitesh Ubrani, research manager for IDC's Worldwide Mobile Device Trackers. "Although new technologies such as 5G and dual- and folding-screen devices along with an uptake in gaming PCs will provide an uplift, these will take some time to coalesce."
According to IDC's data, Lenovo retained the top position and made further share gains compared to 2018, finishing the year with a market share of 24.3%. Outside of the APeJ region, Lenovo grew in almost every other region and led all OEMs with 8.2% year-over-year growth in 2019.
HP Inc. PC volumes grew 4.8% in 2019 with strong fourth quarter growth of 6.9%. HP did a good job navigating the CPU shortages throughout the year and as a result was able to grow its market share to 23.6% (up from 23.1% in 2018).
Dell Technologies retained the third position in the PC market in 2019 and grew its market share 0.5 points over 2018 reaching 17.5% worldwide. Dell recorded its own record high for shipments during the holiday quarter and led the top OEMs with 10.7% year-over-year growth. The growth was largely thanks to a robust U.S. market mixed with strong commercial activity throughout North America and a few other important markets.
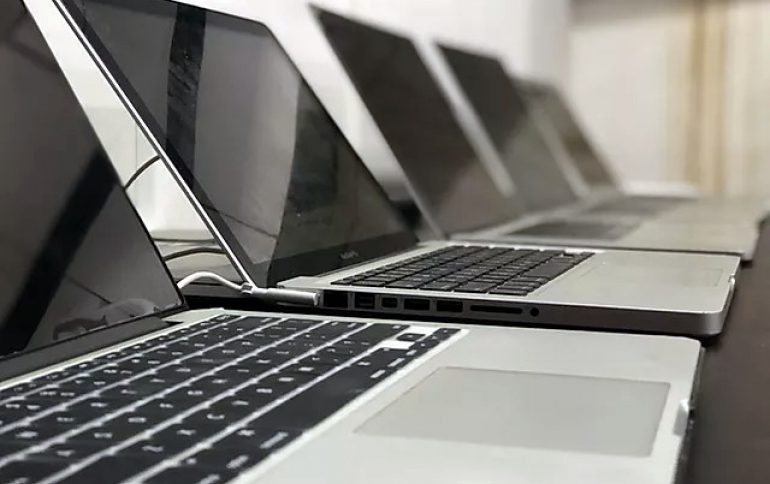
Apple's Mac volumes saw a decline in 4Q19 with 4.7 million units shipped, down 5.3% year over year. Apple's continued momentum in the iPad and iPhone space have more than offset its challenges with Mac volumes, however. Shipment volumes were also down 2.2% for the full year 2019.
Acer Group rounded out the top 5 with 6.1% market share during the quarter and 6.4% for the year. Despite remaining in the top 5, Acer did see volumes decline 4.2% during 4Q19 and 4.6% for the year.
Top Companies, Worldwide Traditional PC Shipments, Market Share, and Year-Over-Year Growth, Q4 2019 (Preliminary results, shipments are in thousands of units) |
|||||
Company |
4Q19 Shipments |
4Q19 Market Share |
4Q18 Shipments |
4Q18 Market Share |
4Q19/4Q18 Growth |
1. Lenovo |
17,832 |
24.8% |
16,751 |
24.4% |
6.5% |
2. HP Inc. |
17,170 |
23.9% |
16,068 |
23.5% |
6.9% |
3. Dell Technologies |
12,463 |
17.4% |
11,259 |
16.4% |
10.7% |
4. Apple |
4,721 |
6.6% |
4,984 |
7.3% |
-5.3% |
5. Acer Group |
4,368 |
6.1% |
4,561 |
6.7% |
-4.2% |
Others |
15,227 |
21.2% |
14,892 |
21.7% |
2.3% |
Total |
71,780 |
100.0% |
68,514 |
100.0% |
4.8% |
Source: IDC Quarterly Personal Computing Device Tracker, January 13, 2020 |
|||||
Top Companies, Worldwide Traditional PC Shipments, Market Share, and Year-Over-Year Growth, 2019 (Preliminary results, shipments are in thousands of units) |
|||||
Company |
2019 Shipments |
2019 Market Share |
2018 Shipments |
2018 Market Share |
2019/2018 Growth |
1. Lenovo |
64,768 |
24.3% |
59,857 |
23.1% |
8.2% |
2. HP Inc. |
62,908 |
23.6% |
60,000 |
23.1% |
4.8% |
3. Dell Technologies |
46,545 |
17.5% |
44,170 |
17.0% |
5.4% |
4. Apple |
17,684 |
6.6% |
18,083 |
7.0% |
-2.2% |
5. Acer Group |
17,029 |
6.4% |
17,853 |
6.9% |
-4.6% |
Others |
57,756 |
21.7% |
59,620 |
23.0% |
-3.1% |
Total |
266,690 |
100.0% |
259,583 |
100.0% |
2.7% |
Source: IDC Quarterly Personal Computing Device Tracker, January 13, 2020 |
|||||


