Asus Xonar D2
9. Test Results 24bit
After the 16bit tests, we proceed to the 24bit tests with the same methodology. We expect to see important differences here, since 24bits is more demanding:
| RMAA v6.0.5 Comparison Test Results | ||
| Testing 24bit/44.1KHz | ASUS Xonar D2 Audio | SoundMAX HD Audio |
| Frequency response (from 40 Hz to 15 kHz), dB: | +0.05, -0.04 | +0.26, -0.07 |
| Noise level, dB (A): | -108.3 | -89.2 |
| Dynamic range, dB (A): | 108.3 | 88.8 |
| THD, %: | 0.0004 | 0.0096 |
| IMD + Noise, %: | 0.0014 | 0.047 |
| Stereo crosstalk, dB: | -110.5 | -87.8 |
| RMAA v6.0.5 Comparison Test Results | ||
| Testing 24bit/48.0KHz | ASUS Xonar D2 Audio | SoundMAX HD Audio |
| Frequency response (from 40 Hz to 15 kHz), dB: | +0.06, -0.04 | +0.11, -0.03 |
| Noise level, dB (A): | -117.2 | -89.3 |
| Dynamic range, dB (A): | 117.2 | 88.9 |
| THD, %: | 0.0004 | 0.0092 |
| IMD + Noise, %: | 0.0006 | 0.014 |
| Stereo crosstalk, dB: | -116.6 | -88.5 |
| RMAA v6.0.5 Comparison Test Results | ||
| Testing 24bit/96.0KHz | ASUS Xonar D2 Audio | SoundMAX HD Audio |
| Frequency response (from 40 Hz to 15 kHz), dB: | +0.08, -0.05 | +0.02, -0.06 |
| Noise level, dB (A): | -117.2 | -89.5 |
| Dynamic range, dB (A): | 117.1 | 89.1 |
| THD, %: | 0.0007 | 0.0093 |
| IMD + Noise, %: | 0.0007 | 0.014 |
| Stereo crosstalk, dB: | -115.3 | -85.9 |
At the best recording quality, the differences are significant:
| RMAA v6.0.5 Comparison Test Results | ||
| Testing 24bit/192.0KHz | ASUS Xonar D2 Audio | SoundMAX HD Audio |
| Frequency response (from 40 Hz to 15 kHz), dB: | +0.08, -0.05 | +0.04, -0.17 |
| Noise level, dB (A): | -116.3 | -89.4 |
| Dynamic range, dB (A): | 116.3 | 89.1 |
| THD, %: | 0.0013 | 0.0091 |
| IMD + Noise, %: | 0.0012 | 0.014 |
| Stereo crosstalk, dB: | -112.5 | -85.3 |
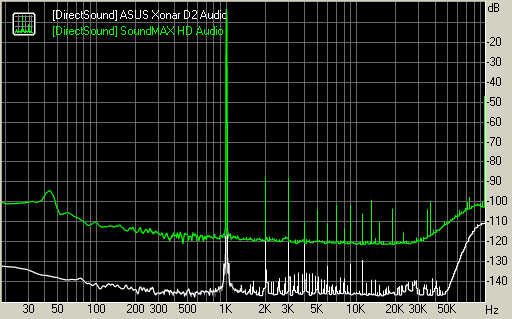
Looking at the Noise Level, we see a difference of 26.9dB! The TDH% levels are much better than what the SoundMAX HD Audio chipset can offer:
Frequency response graph

Noise level graph
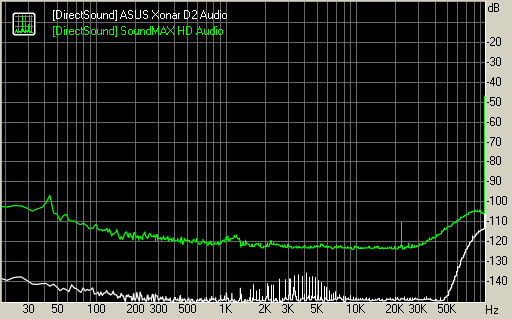
Dynamic range
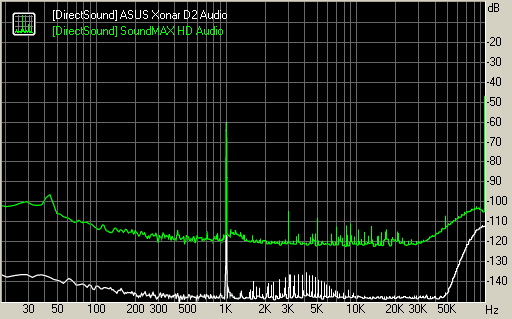
Intermodulation distortion graph
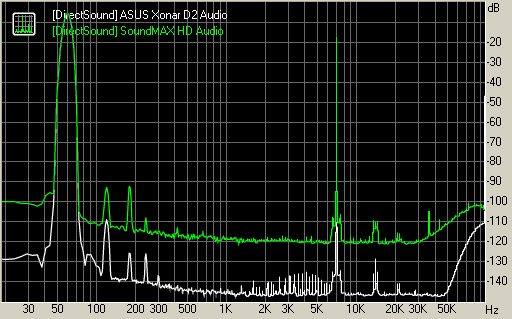
THD + Noise (at -3 dB FS) graph:
