Intel QX6700
14. MAC OSX Benchmarks - Page 2
Review Pages
2. Conroe QX6700 (Kentsfield)
3. Installation
4. Tests
5. Everest Ultimate Edition 2006
6. PCMARK - 3DMARK
7. Science Mark - Nero Digital
8. CINEBENCH -SuperPI
9. F.E.A.R.
10. Splinter Cell Chaos Theory
11. Overclocking - Page 1
12. Overclocking - Page 2
13. MAC OSX Benchmarks - Page 1
14. MAC OSX Benchmarks - Page 2
15. Advanced Video Encoding
16. Conclusion
 CINEBENCH is the free benchmarking tool for Windows and Mac OSX based on the powerful 3D software CINEMA 4D. Consequently, the results of tests conducted using CINEBENCH 9.5 carry significant weight when analyzing a computer’s performance in everyday use. Maxon's Cinebench has been a good benchmark measuring Quad core under Windows. Higher numbers, indicating faster processing rates, are better.
Here's a summary of the posted results:
- Rendering (1 CPU): single-CPU performance (not disk-related). (A value of 100 is approximately equivalent to a 1GHz Pentium 4.)
- Rendering (x CPU): same test but using multiple processors where available.
- C4D Shading: Uses Cinema 4D software to render huge numbers of polygons.
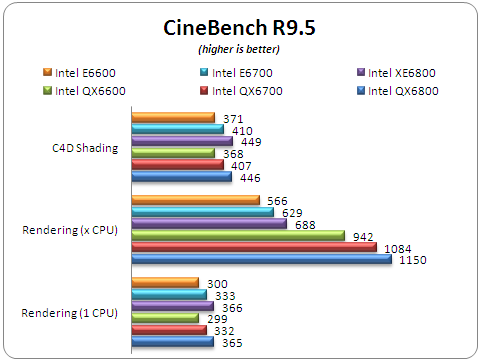
CineBench is one of the few benchmarks that support multi-core. As was expected, the Intel QX6800 rated at 2.93GHz, outperforms all processors, at least in the "Rendering (x CPU)" test. In other cases, the Intel XE6800 is faster, even if by a small margin.
![]() Geekbench is a new benchmarking program that tests memory and CPU performance with single and multi-core processor support. The software reports many numbers and for our comparison, we will get the "index" score.
Geekbench is a new benchmarking program that tests memory and CPU performance with single and multi-core processor support. The software reports many numbers and for our comparison, we will get the "index" score.
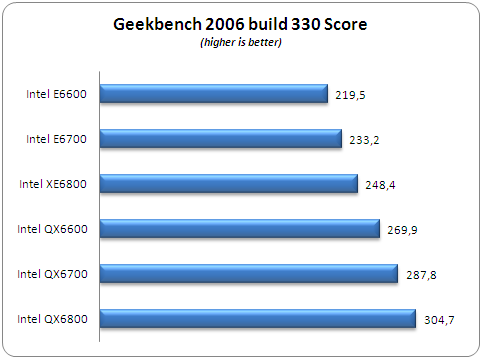
As was expected, the Quad Core CPUs are faster than the Dual core. You can view the analytical test results for each processor E6600, E6700, XE6800, QX6600, QX6700, QX6800.
![]() Xbench has been the standard for Mac benchmarking in recent years. This shareware application is easy to run and produces detailed results for many different performance parameters, as well as some helpful information about the test configuration.
Xbench has been the standard for Mac benchmarking in recent years. This shareware application is easy to run and produces detailed results for many different performance parameters, as well as some helpful information about the test configuration.
Xbench results are a bit tricky, since they vary widely from run to run and can be overly sensitive to small configuration details.

XBench v1.3 seems to be affected by the Quad Core processors and produced higher ranking scores for all QX series.
![]() Java SciMark 2 has been developed by NIST. The procedure we used to have the exactly same results at all tests was to open a terminal application and then type: appletviewer http://math.nist.gov/scimark2/run.html. At the end of the test you can see all six result numbers. Results are shown in Mflops (Millions of floating point operations per second), so higher numbers are better than lower ones. We sum all produced test results for an overall score.
Java SciMark 2 has been developed by NIST. The procedure we used to have the exactly same results at all tests was to open a terminal application and then type: appletviewer http://math.nist.gov/scimark2/run.html. At the end of the test you can see all six result numbers. Results are shown in Mflops (Millions of floating point operations per second), so higher numbers are better than lower ones. We sum all produced test results for an overall score.

SciMark 2.0 doesn't use Quad cores and the test results shows it clearly.
Review Pages
2. Conroe QX6700 (Kentsfield)
3. Installation
4. Tests
5. Everest Ultimate Edition 2006
6. PCMARK - 3DMARK
7. Science Mark - Nero Digital
8. CINEBENCH -SuperPI
9. F.E.A.R.
10. Splinter Cell Chaos Theory
11. Overclocking - Page 1
12. Overclocking - Page 2
13. MAC OSX Benchmarks - Page 1
14. MAC OSX Benchmarks - Page 2
15. Advanced Video Encoding
16. Conclusion