Arctic Liquid Freezer III 280 ARGB
4. Tests
- CPU: AMD Ryzen 9 7950X
- Thermal Paste: Noctua NT-H1 thermal compound
- Open Case: StreaCom BC1 V2 Bench Table
- Motherboard: Asus ProArt X670E-CREATOR WIFI with 2007 BIOS
- Memory: 2x24GB Crucial DDR5-6000 CL48 (EXPO Profile)
- PSU: be quiet! Dark Pro 13 1300Watt
- Main Storage: Samsung 980Pro 1TB
- VGA: MSI GeForce RTX 4090 SUPRIM X 24G
- Operating system: Windows 11 x64 + latest motherboard/AMD chipset drivers installed (DirectStorage enabled drive)
- Software: OCCT Enterprise Edition v12.1.18 (2 sec interval monitor)
- Ambient room temperature ~ 23 Celsius (with AC climate control) - Environment Temperature measurements: Precision Gold N09AQ Envirometer Meter
We performed four tests depending on the CPU TDP load that can be set under Bios-> AI Tweaker-> Precision Boost Overdrive->AMD Eco Mode->
- cTDP 65Watt (real 90Watt)
- cTDP 105Watt (real 145watt)
- cTDP 170Watt (normal AMD 7950X operating from 175watt up to 190watt depending Boost)
- cTDP ~ 222Watt (via PBO at auto)
while we set the following voltages for all tests.
- CPU Core Voltage: Auto
- CPU SOC Voltage: 1.25V
- CPU VDDIO / MC Voltage: Auto
- Misc Voltage: 1.10V
At the OCCT software, we performed the Stability Test->CPU Test 15mins duration with various settings to get the maximum thermal production from the AMD 7950X.
Tests Disclaimer: Despite placing CPU voltages manually, the motherboard may supply the CPU with slightly different voltages, resulting in some cases higher temperatures that also result in higher working temperatures. Our results are valid with the above test system and using other variations may result in different results. Using other stress test software may also introduce different test results.
Before each run, we clean the CPU surface with 95% isopropyl alcohol and paper roll and we apply each thermal paste with the same methodology (central dot, small X lines, and small dots) to cover the full surface of the CPU area.
The Asus motherboard presented its rotation curve with a %10 gap, as we can see the maximum RPM is 1854, while under 10% the fans can be stopped.

All of our tests are done with the default Asus PWM curve fan.

Starting from the low 65watt AMD Eco TDP, we used the following OCCT settings
- Instruction Set: Auto
- Data Set: Large
- Mode: Normal
- Load Type: Variable
- Thread Settings: Auto
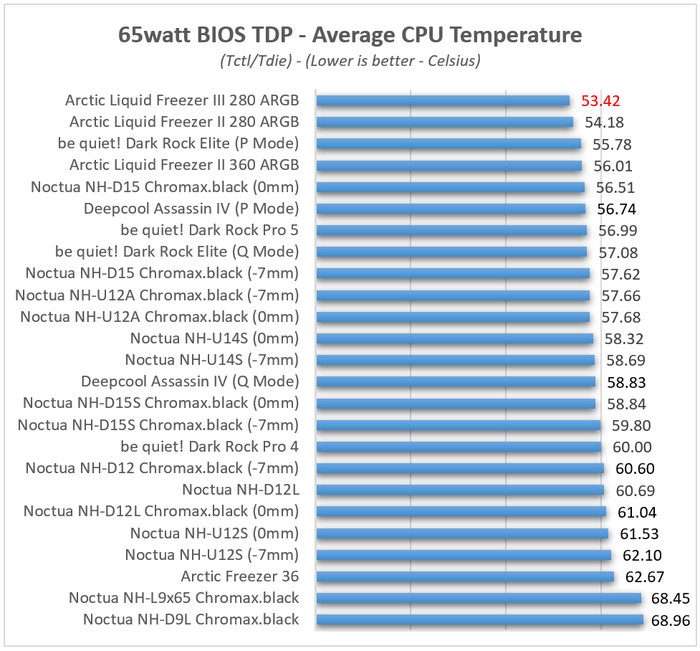
The Arctic Liquid Freezer III 280 A-RGB has the "best" overall performance with 53.42 Celsius. The Liquid Freezer II A-RGB is very close as well.

At the 105watt AMD Eco TDP setting, we used the following OCCT settings
- Instruction Set: Auto
- Data Set: Large
- Mode: Normal
- Load Type: Variable
- Thread Settings: Auto
Increasing the TDP load at all CPU coolers will probably increase their performance differences. The Arctic Freezer III 280 A-RGB has slightly worse performance compared with the Liquid Freezer II 280 A-RGB, we double-checked the performance tests and in all cases, this scenario was confirmed.

At the 170watt AMD TDP setting (normal AMD 7950X running TDP), we used the following OCCT settings
- Instruction Set: SSE
- Data Set: Large
- Mode: Normal
- Load Type: Variable
- Thread Settings: Auto
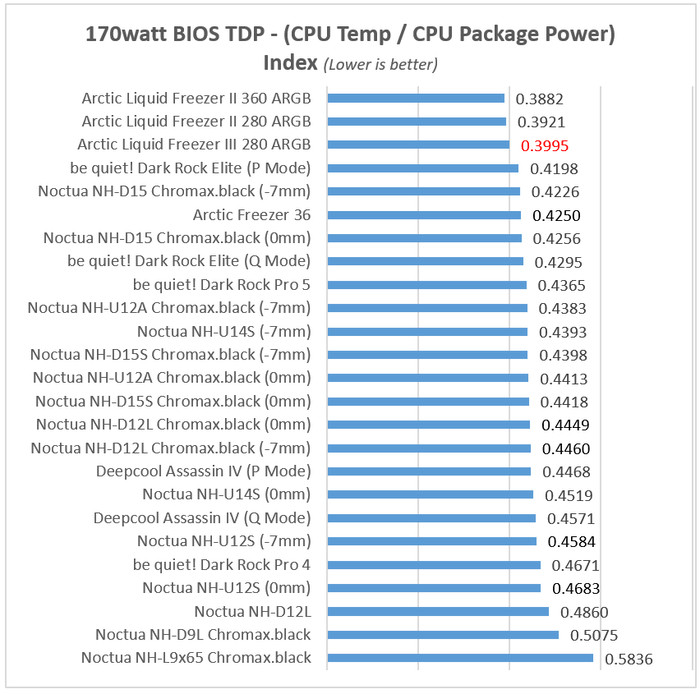
At this TDP, we don't post absolute thermal numbers, since at some point the AMD 7950X boosted up to 170TDP and other cases at 190TDP, so we only post an index that calculates the produced temperature / the total CPU package power, in other words, the smaller the index is the better performance you will gain. In this test, the Liquid Freezer III 280 A-RGB showed close performance with the Liquid Freezer II A-RGB.

At the 222watt AMD TDP setting, we used the following OCCT settings
- Instruction Set: SSE
- Data Set: Small
- Mode: Extreme
- Load Type: Steady
- Thread Settings: Auto
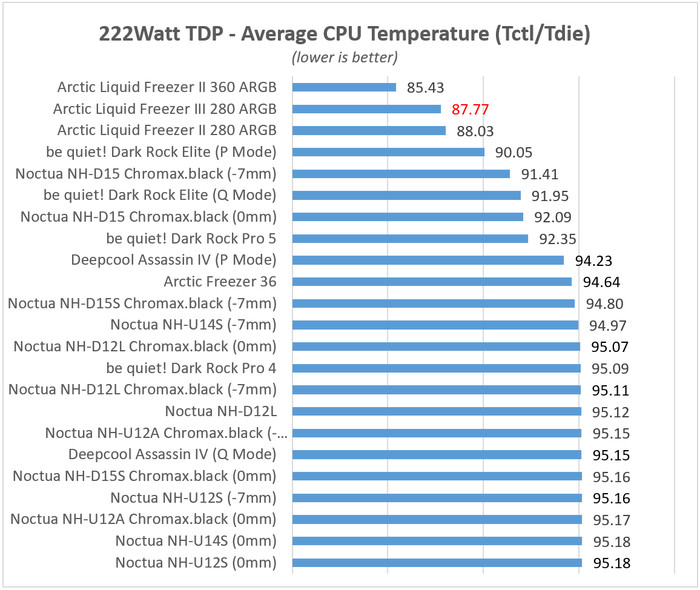
At the maximum possible TDP with the AMD 7950X for our tests, we see that the Arctic Liquid III 280 A-RGB is again very close to the Liquid Freezer II 280 A-RGB.


