OCZ Agility 3 240GB SSD review
4. Benchmarks - page 1
Review Pages
Here is our testbed:
- Motherboard: Foxconn Quantum Force Rattler P67 vP04 BIOS
- Processor: Intel Core i5-2500K
- Case: Open Air testbed
- Power Supply Unit: Club 3D CSP-X1000CB 1000 Watt
- Graphics card: Club3D Radeon HD 6790 CoolStream Edition
- Memory: OCZ Gold PC3-10600 4x2GB 1333@CL9
- HDD: WD 500GB 7200RPM
- Monitor: LG L246WH-BH 24"
- Windows 7 x64 SP1 with latest updates installed
For the tests, we used the following software:
- HDTachRW v3.0.1.0
- HD Tune v4.50 Pro
- Crystal DiskMark v3
- ATTO Disk Benchmark v2.46
- ASS SSD Benchmark 1.5xxx
- IOMeter v2006.07.27 with Xtreme Benchmark template
- PCMark Professional edition v1.04
- AIDA64 Disk Benchmark Extreme Edition
- Sysoft Sandra
We start the tests with the HDTachRW software. HD Tach is a low level hardware benchmark for random access read/write storage devices. The software measures the sequential read speed (at various points on the device), the random access speed and sequential write speed.
The software reported an average sequential writing speed of 375.5MB/s and a sequential reading of 368.1 MB/s.

These figures are not exactly those quoted by OCZ but still, it is a good performance.This is not the first time we see an SSD performing lower than expected in this benchmark. That's mainly due to the fact that the HD Tach sequential read test is different from other benchmarks. Most benchmarks create a file on the drive and test within that file. But the latest drives use a zone bit recording technique that allows different read speeds depending on where the data is located. This means that data on the outside of the drive is much faster than data recorded on the inside.
In addition, HDTach’s fixed strides between sample points are sometimes causes issues. The software uses fixed strides across the array to measure small block sizes. The periodicities of the stride pattern and the flash memory address space may cause some wave-like interference patterns of the benchmark results that are also measuring artifacts rather than being indicative of performance.
In addition to sequential read performance, HD Tach tests the drive's random access time. In this case, the software returned a very fast 0.1 ms for the Agility 3 drive.
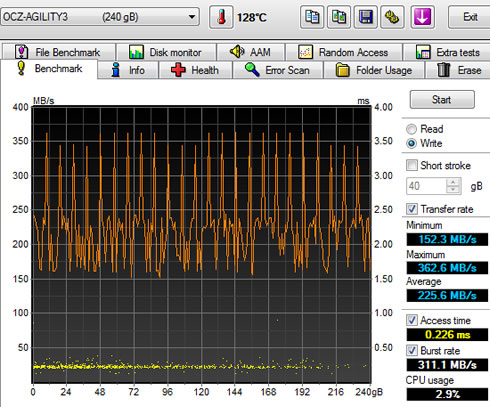
We move on to the HD Tune Pro software, another utility we used to measure the drive's reading performance. Although not necessarily representative of real-world workloads, HD Tune's targeted tests give us a glimpse of each drive's raw capabilities.
In the a sequential read test, the drive read the data at 270.5MB/s (average). This time the reported access time was 0.216 ms:

In the corresponding reading test, the drive wrote the data sequentially on the disc at 225.6 MB/s.
Here is another sequential file test. The software used 64MB of data comprising out of sizes ranging from 0,5 KB to 8 MB. As you see in the benchmark below, the drive was faster once it passed the 128KB file size. The performance for write topped at around 460MB/s and for read close to 520MB/s. Both results are very close to the nominal performance figures promised by OCZ:


The HD Tune Pro also allows random access read testing. Here are some more results with the software to randomly seek files of different sizes:
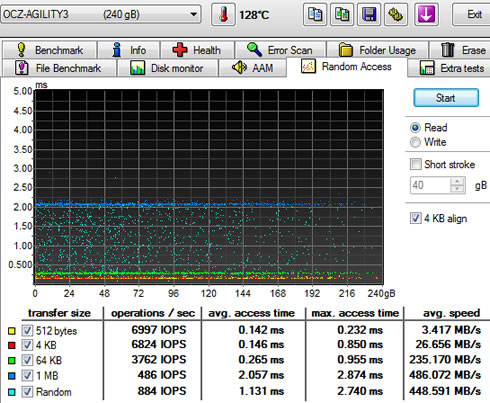
The 512 bytes performance of the Agility 3 was OK for the drive, particularly the read throughput which reached 3.417 MB/s. The 1MB performance was very strong at 486.072 MB/s. If you remember the performance of the Agility 2 series, it had given a 260 MB/sec here.
Finally at the random read tests, which use random file sizes, the drive kept offering very high reading speeds.
The next software we used was the ATTO Disk Benchmark. The tool measures storage systems performance with various transfer sizes and test lengths for reads and writes. The benchmark performs file transfers ranging from 0.5 KB to 8192 KB.
The drive gave the expected performance with an average more than 500 MB/s for write and more than 450MB/s for read , with files larger than 128 KB, in Queue Depth 4.
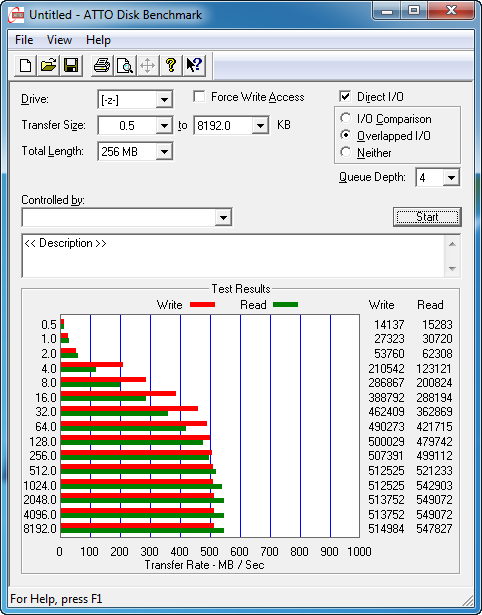
Generally, ATTO is the preferred standard benchmarking software as while it runs spot data is has several advantages over other HDD benchmarks including the fact that it shows the specific speed of each file size transfer and shows a true average, this benchmarking product also doesn't seem to favor SRAM over DRAM caches. In addition, the SandForce controller is able to compress the data on the fly and it gets a lot of speed out of this function. The ATTO test files are very easy to compress and the SandForce Controller is getting best values in this benchmark.
The next benchmark is the CrystalDiskMark. The software provides throughput data based on sequential reads and writes, and random (512K/4K/4KQD32) reads and writes. For the first test we used the default 1,000MB file-size:
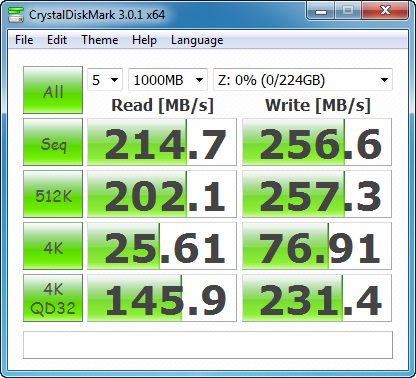
Sequential tests on this SandForce SSD produced a maximum read speed of 214.7 MB/s, while the write speed was just 25.6 MB/s. Both results are very low since the test used incompressible data. CrystalDiskMark offers an alternative 'compressible' setting called 0×00 fill.
With the 0×00 0Fill setting, the drive's sequential performance has been restored to normal levels:

CrystalDiskMark 3.0 reported 512K results of 425.4 MB/s read and 448.4 MB/s write performance, which is great.
4K tests produced 31.25 read and 74.46 write performance.
4KB queue depth 32 IOPS is one area where high-end SSDs excel. The Agility 3 SSD gave a good performance for the category.
We proceed with the AS SSD benchmark, which contains five synthetic as well as three practical tests. The synthetic tests determine the sequential and the random read / write performance of an SSD. These tests are carried out without using the operating system's cache. The Seq-test measures how long it takes to read and write an 1GB file. Most importantly, this sequential benchmark uses incompressible data for all of its transfers, meaning that we should not expect the very high performance figures we saw with other benchmarks, since the SandForce SSD will not be able to take advantage of the compression "trick" that boosts its performance.
The 4K benchmark tests the read and write performance for random 4K blocks. The 4K-64-THRD-test corresponds to the 4K procedure except that here the read and write operations are distributed on 64 threads.

The result is a pretty big reduction in sequential write speed on SandForce based controllers.
Beginning with sequential read and write performance, the Agility 3 SSD produced 213.15 MB/s read speed, and 240.53 MB/s write performance. Here the Agility 3's performance suffers.
Single-threaded 4K IOPS performance delivers 19.31 MB/s read and 62.38 MB/s write, while the 64-thread 4K reads recorded 151.34 MB/s and write performance was 208.50 MB/s.
In addition, although the drive showed decent access times for read (0.249 ms,) it was significantly faster during write (0.154 ms).
AS-SDD use files, that are not t very easily to compress and the Sandforce controller loses the benefice of the "on the fly compression". So the real real life should be something between ATTO and AS-SSD.
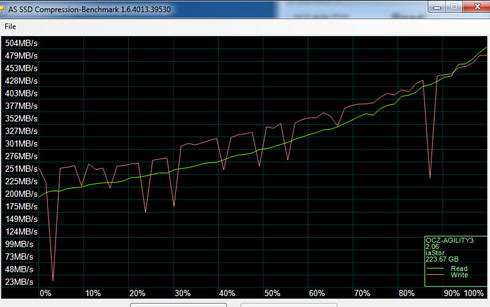
In the following test, the OCZ Agility 3 240GB SSD is reading and writing files, which have been partially of fully compressed. As it was expected , the more compressed the files returned higher read / write performance:
Review Pages


