Windows XP Professional x64 Edition
17. Application Benchmarks - SiSoftware Sandra 2004
Review Pages
2. System Specifications
3. Product Overview
4. Compatibility
5. Security Issues
6. Gaming Experience
7. Availability And Price
8. Windows Installation
9. Drivers Installation
10. Test System
11. Game Benchmarks - Far Cry
12. Game Benchmarks - Colin McRae 2005
13. Game Benchmarks - Half Life 2
14. Application Benchmarks - 3DMark2003
15. Application Benchmarks - 3DMark2005
16. Application Benchmarks - PCMark04
17. Application Benchmarks - SiSoftware Sandra 2004
18. Application Benchmarks - Science Mark 2
19. Application Benchmarks - Pov-Ray
20. Conclusion
21. Drivers Availability
22. Programs that are not supported
SiSoftware Sandra 2004
 SiSoftware Sandra (the System ANalyzer, Diagnostic and Reporting Assistant) is an information & diagnostic utility. It should provide most of the information (including undocumented) you need to know about your hardware, software and other devices whether hardware or software.
CPU Arithmetic Benchmark
Sandra's CPU arithmetic benchmark suite uses 2 famous benchmarks (Dhrystone and Whetstone) for stress testing the processor. Also it includes a new version of the Whetstone test that makes use of a processor's SSE2 instructions to show the performance boost an application might gain should it be optimized for SSE2. Unfortunately this does not always represent a true real-life performance, but is useful to compare the speed of various CPUs.
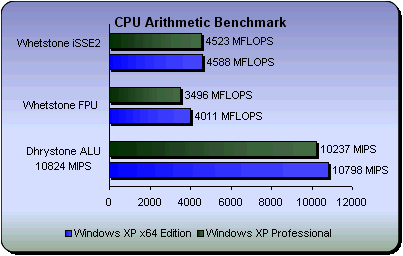
The 64-Bit performance benefits in this test show only 65 iterations per second more with the SSE2 instructions and about 500 more for the Whetstone FPU (floating point) and Dhrystone (arithmetic) benchmark.
CPU Multimedia Benchmark
This test involves the generation of Mandelbrot Set fractals that are used to realistically describe and generate natural objects such as mountains or clouds. By using various multi-media extensions MMX, 3DNow! and SSE(2/3) better performance is achieved.
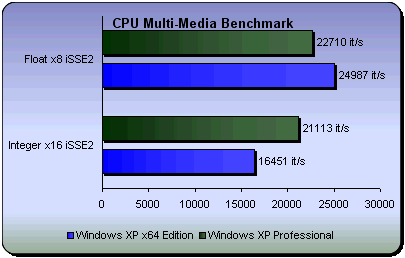
Here the benchmark takes advantage of the x8 SSE2 instructions for floating points and x16 SSE2 for integers, we managed to get about 5000 iterations per second less (about 23%) with integers and 2000 iterations more (about 9%) with floating point.
Memory Bandwidth Benchmark
This tests examines how your memory sub-system compares to other systems with the same or similar memory. The benchmark is based on the well-known STREAM memory bandwidth benchmark.(The main difference is that STREAM 2.0 uses static data (about 12M) but SiSoftware Sandra uses dynamic data (around 40-60% of physical system RAM). )

Although this test is highly dependent on the memory modules used, we observe slightly lower performance with Windows XP x64.
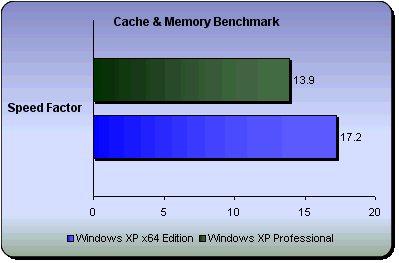
Cache & Memory Benchmark
This test is based on the Memory Bandwidth Benchmark test. The difference is that the memory index is lower as streaming/buffering/block pre-fetch is not used on this test to increase performance with small blocks (it is usefull only in large amounts of data)
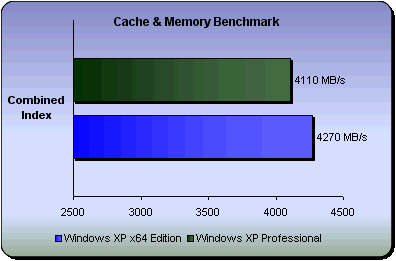
Combined Index: is a composite figure representing the overall performance rating of the entire Cache-Memory performance in terms of MB/s. The value is a result of the logarithmic average of all the results for the entire address space.Here we notice a small lead for windows XP x64
Speed Factor: Represents the speed differences between the CPU's cache and memory. The value is a result of the ratio of the fastest cache (for example L1) bandwidth to the main memory bandwidth, which means that the lower the result, the better for us. Here we have Windows XP professional lagging behind by about 20%.
HDD Benchmark
This Benchmark is a composite figure representing an overall performance rating based on the average of the read, write, and seek tests, and file and cache size. It is intended to represent hard disk drive performance under typical use in a PC. A larger number means better performance. The weighting of the results is not equal that it represents the distribution of different files sizes as used on these devices (obtained through field research).

Combined Index: is a composite figure representing an overall performance rating based on the average of the Combined Index figures over the four file sizes. This test measures the time that 4 files of the following size: 512 Bytes, 32KB, 256KB and 2MB can be read, written and deleted (the number of files per minute). Windows XP x64 shows a performance lead of about 5000 operations per minute.
Review Pages
2. System Specifications
3. Product Overview
4. Compatibility
5. Security Issues
6. Gaming Experience
7. Availability And Price
8. Windows Installation
9. Drivers Installation
10. Test System
11. Game Benchmarks - Far Cry
12. Game Benchmarks - Colin McRae 2005
13. Game Benchmarks - Half Life 2
14. Application Benchmarks - 3DMark2003
15. Application Benchmarks - 3DMark2005
16. Application Benchmarks - PCMark04
17. Application Benchmarks - SiSoftware Sandra 2004
18. Application Benchmarks - Science Mark 2
19. Application Benchmarks - Pov-Ray
20. Conclusion
21. Drivers Availability
22. Programs that are not supported

